
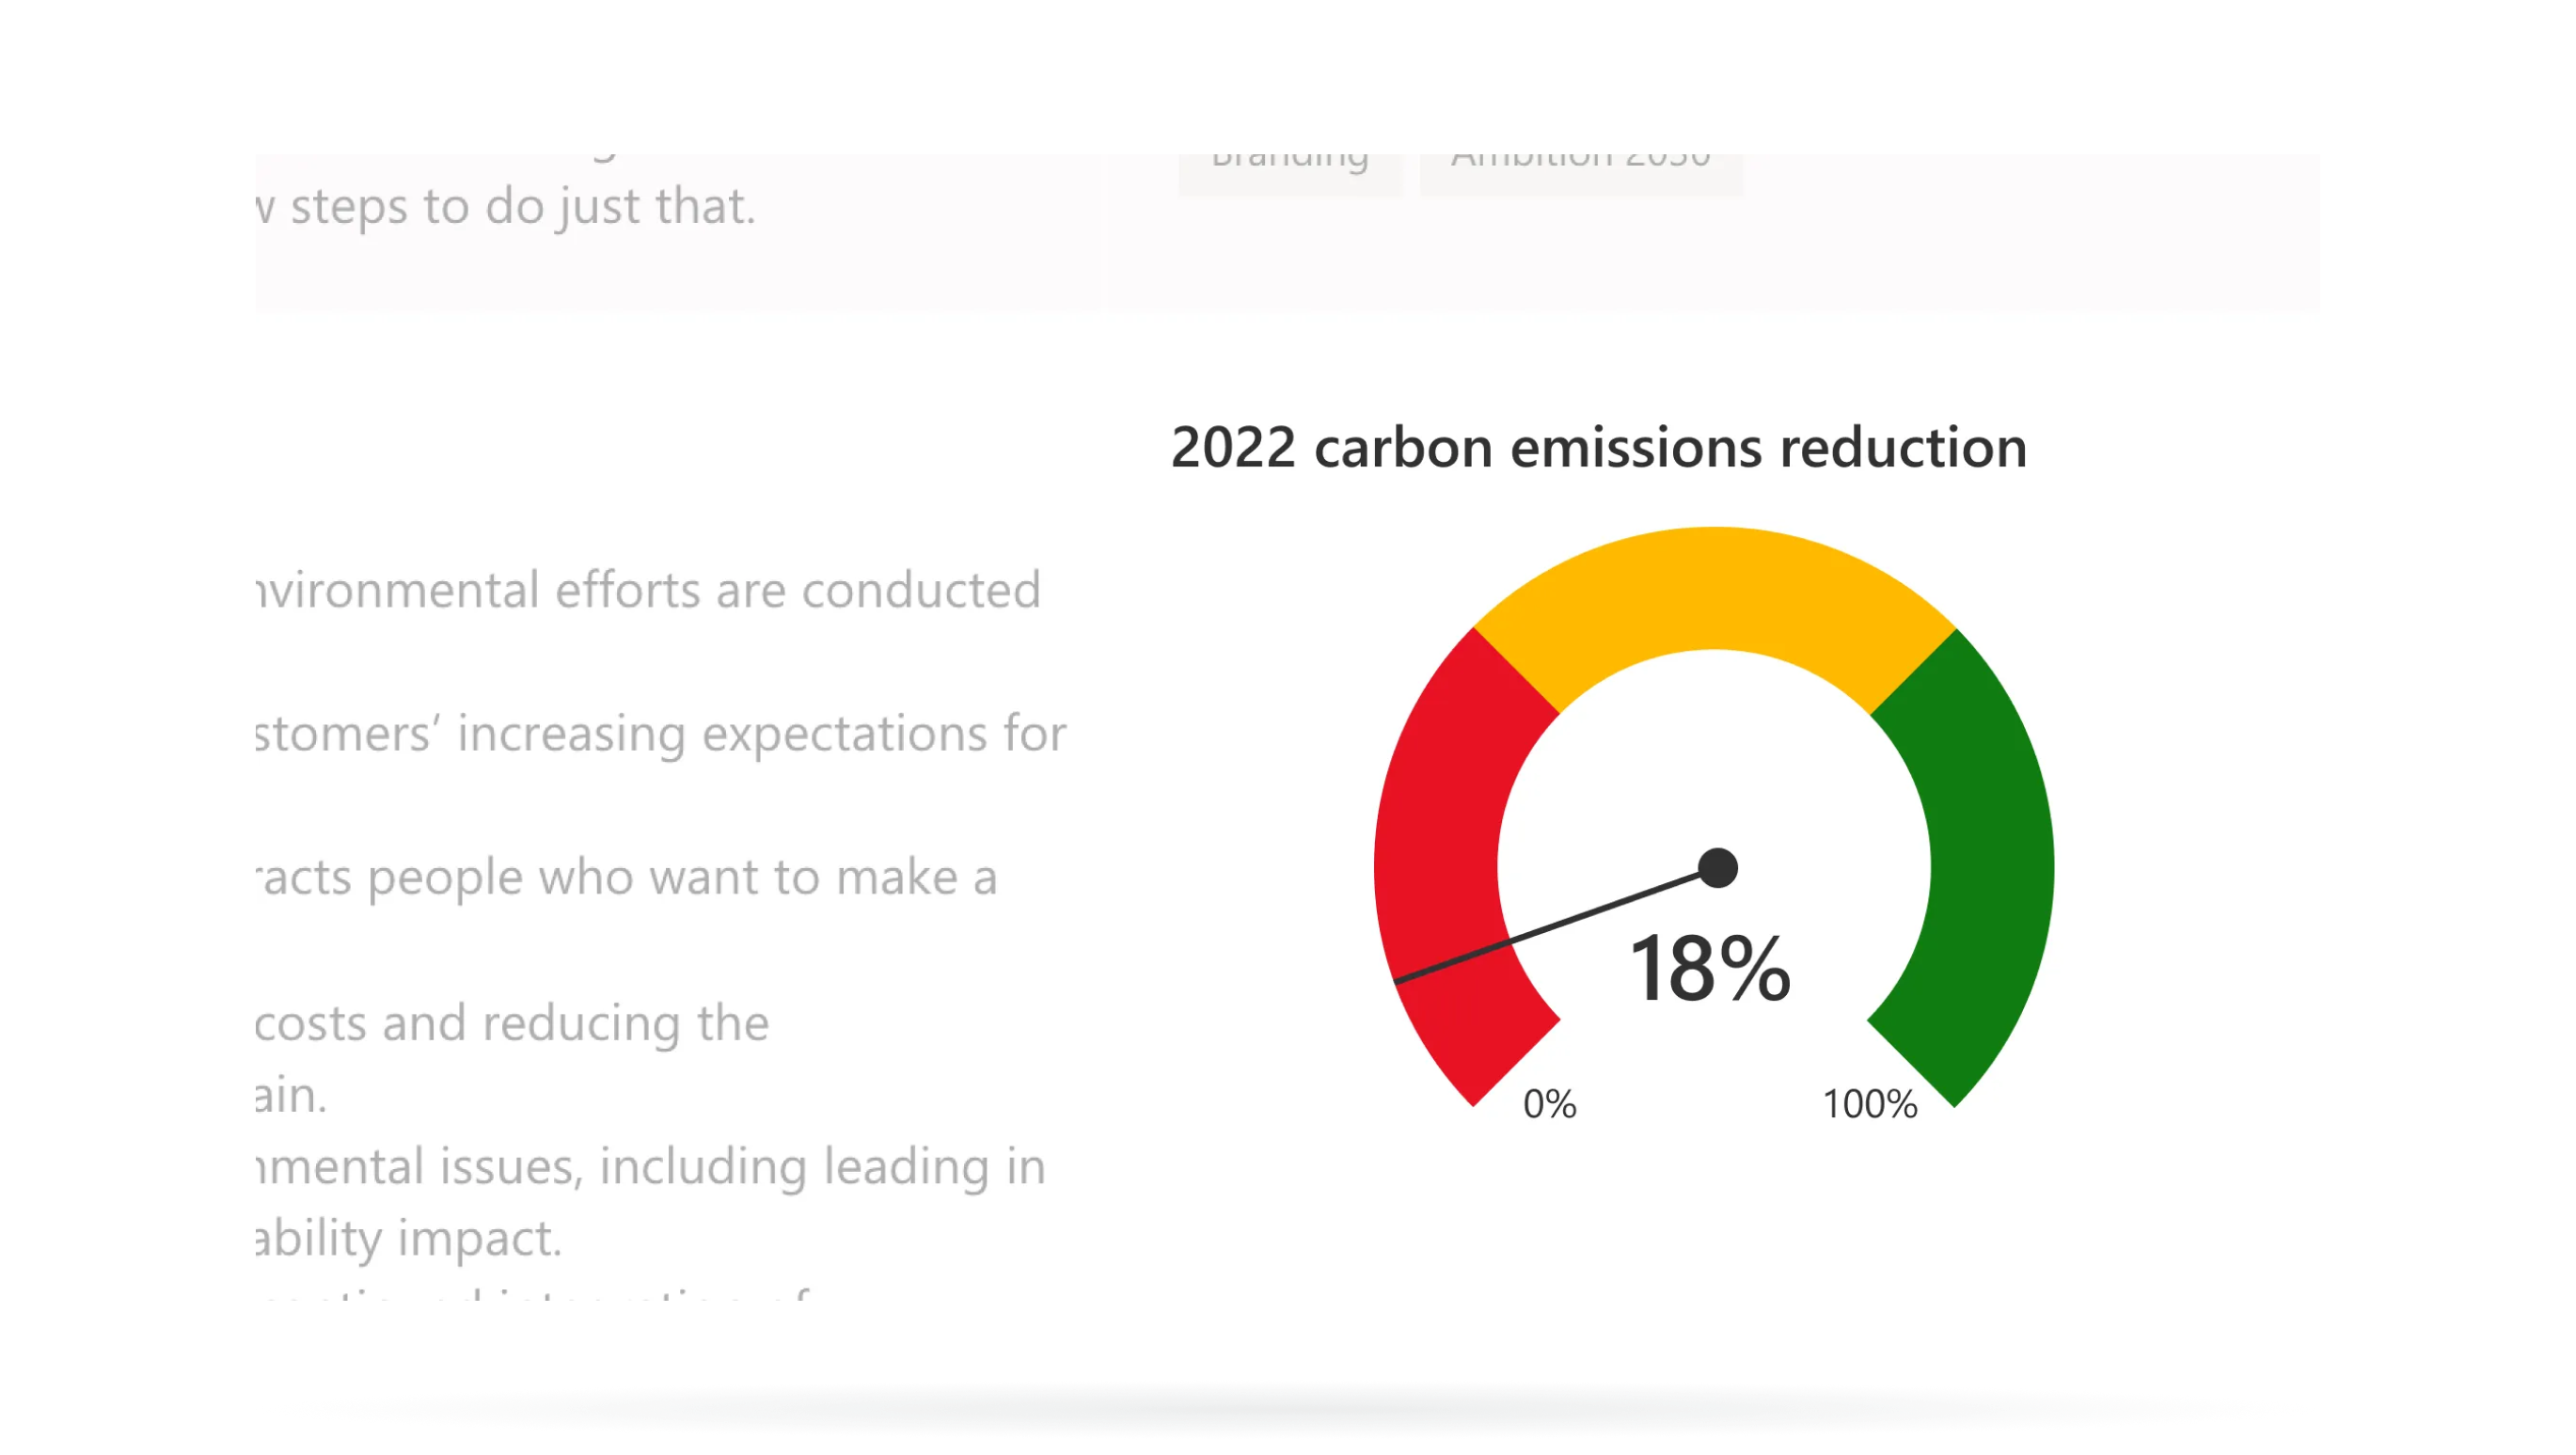

Gauge
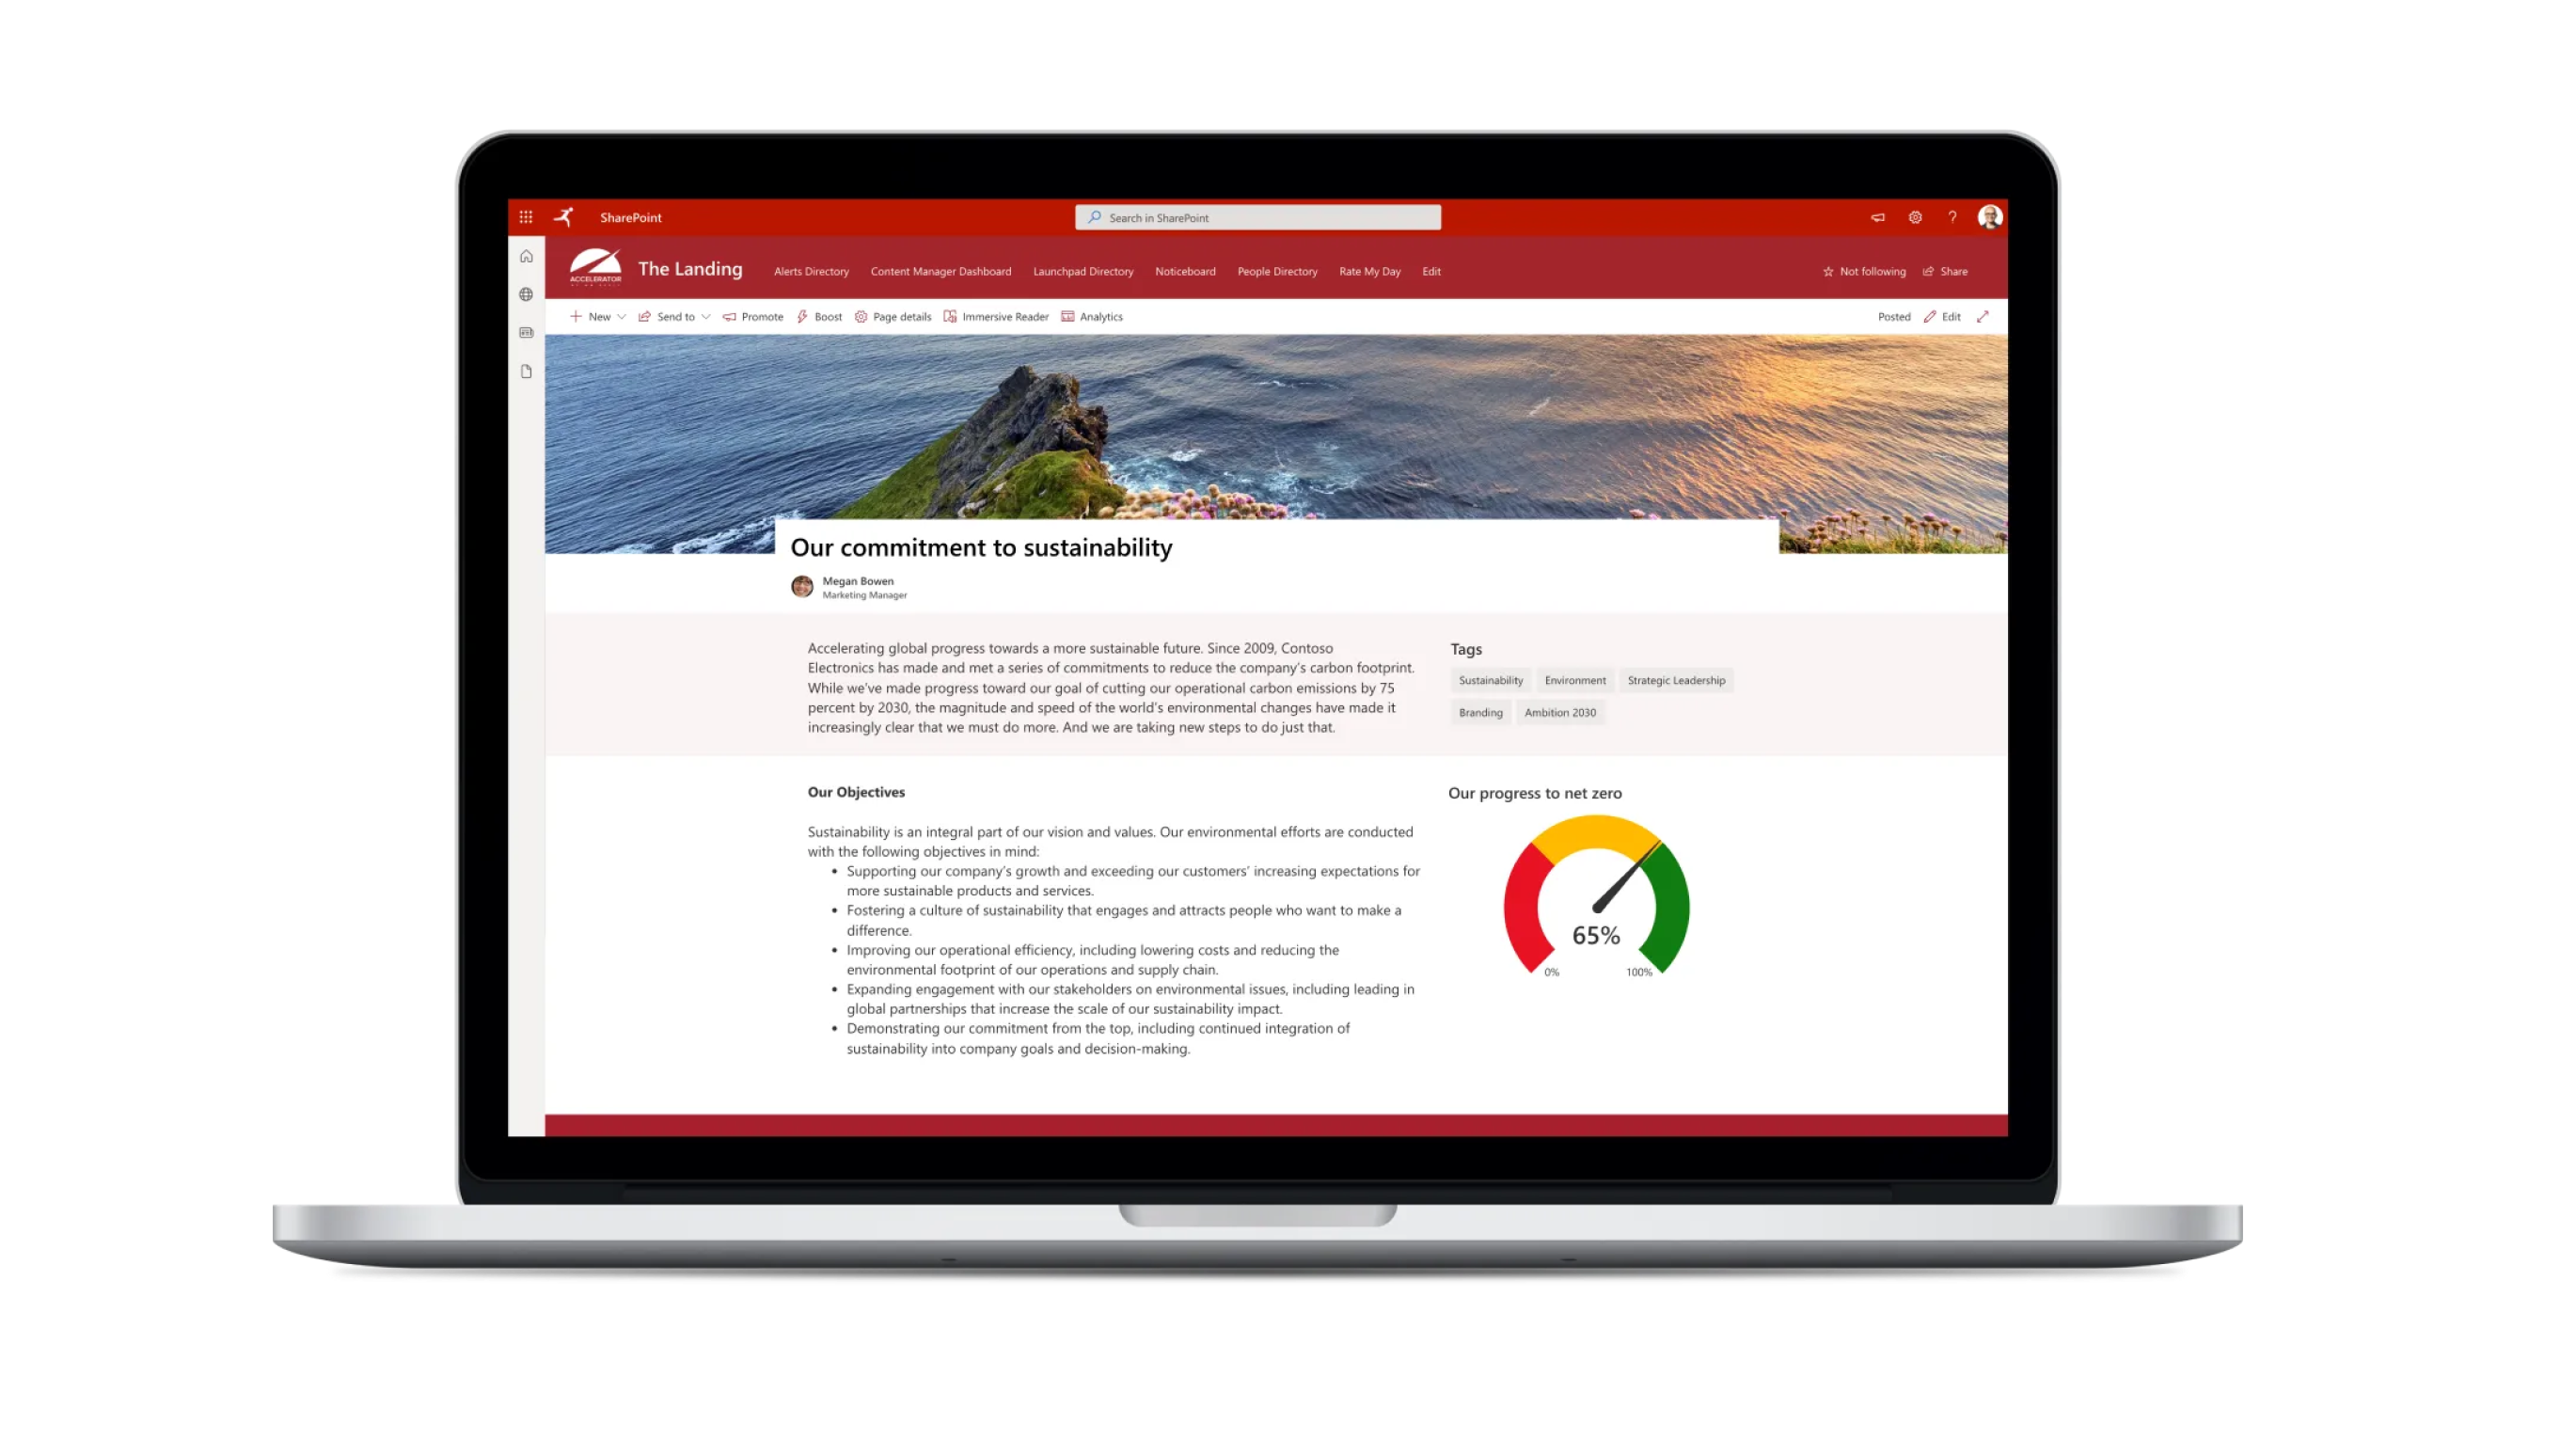
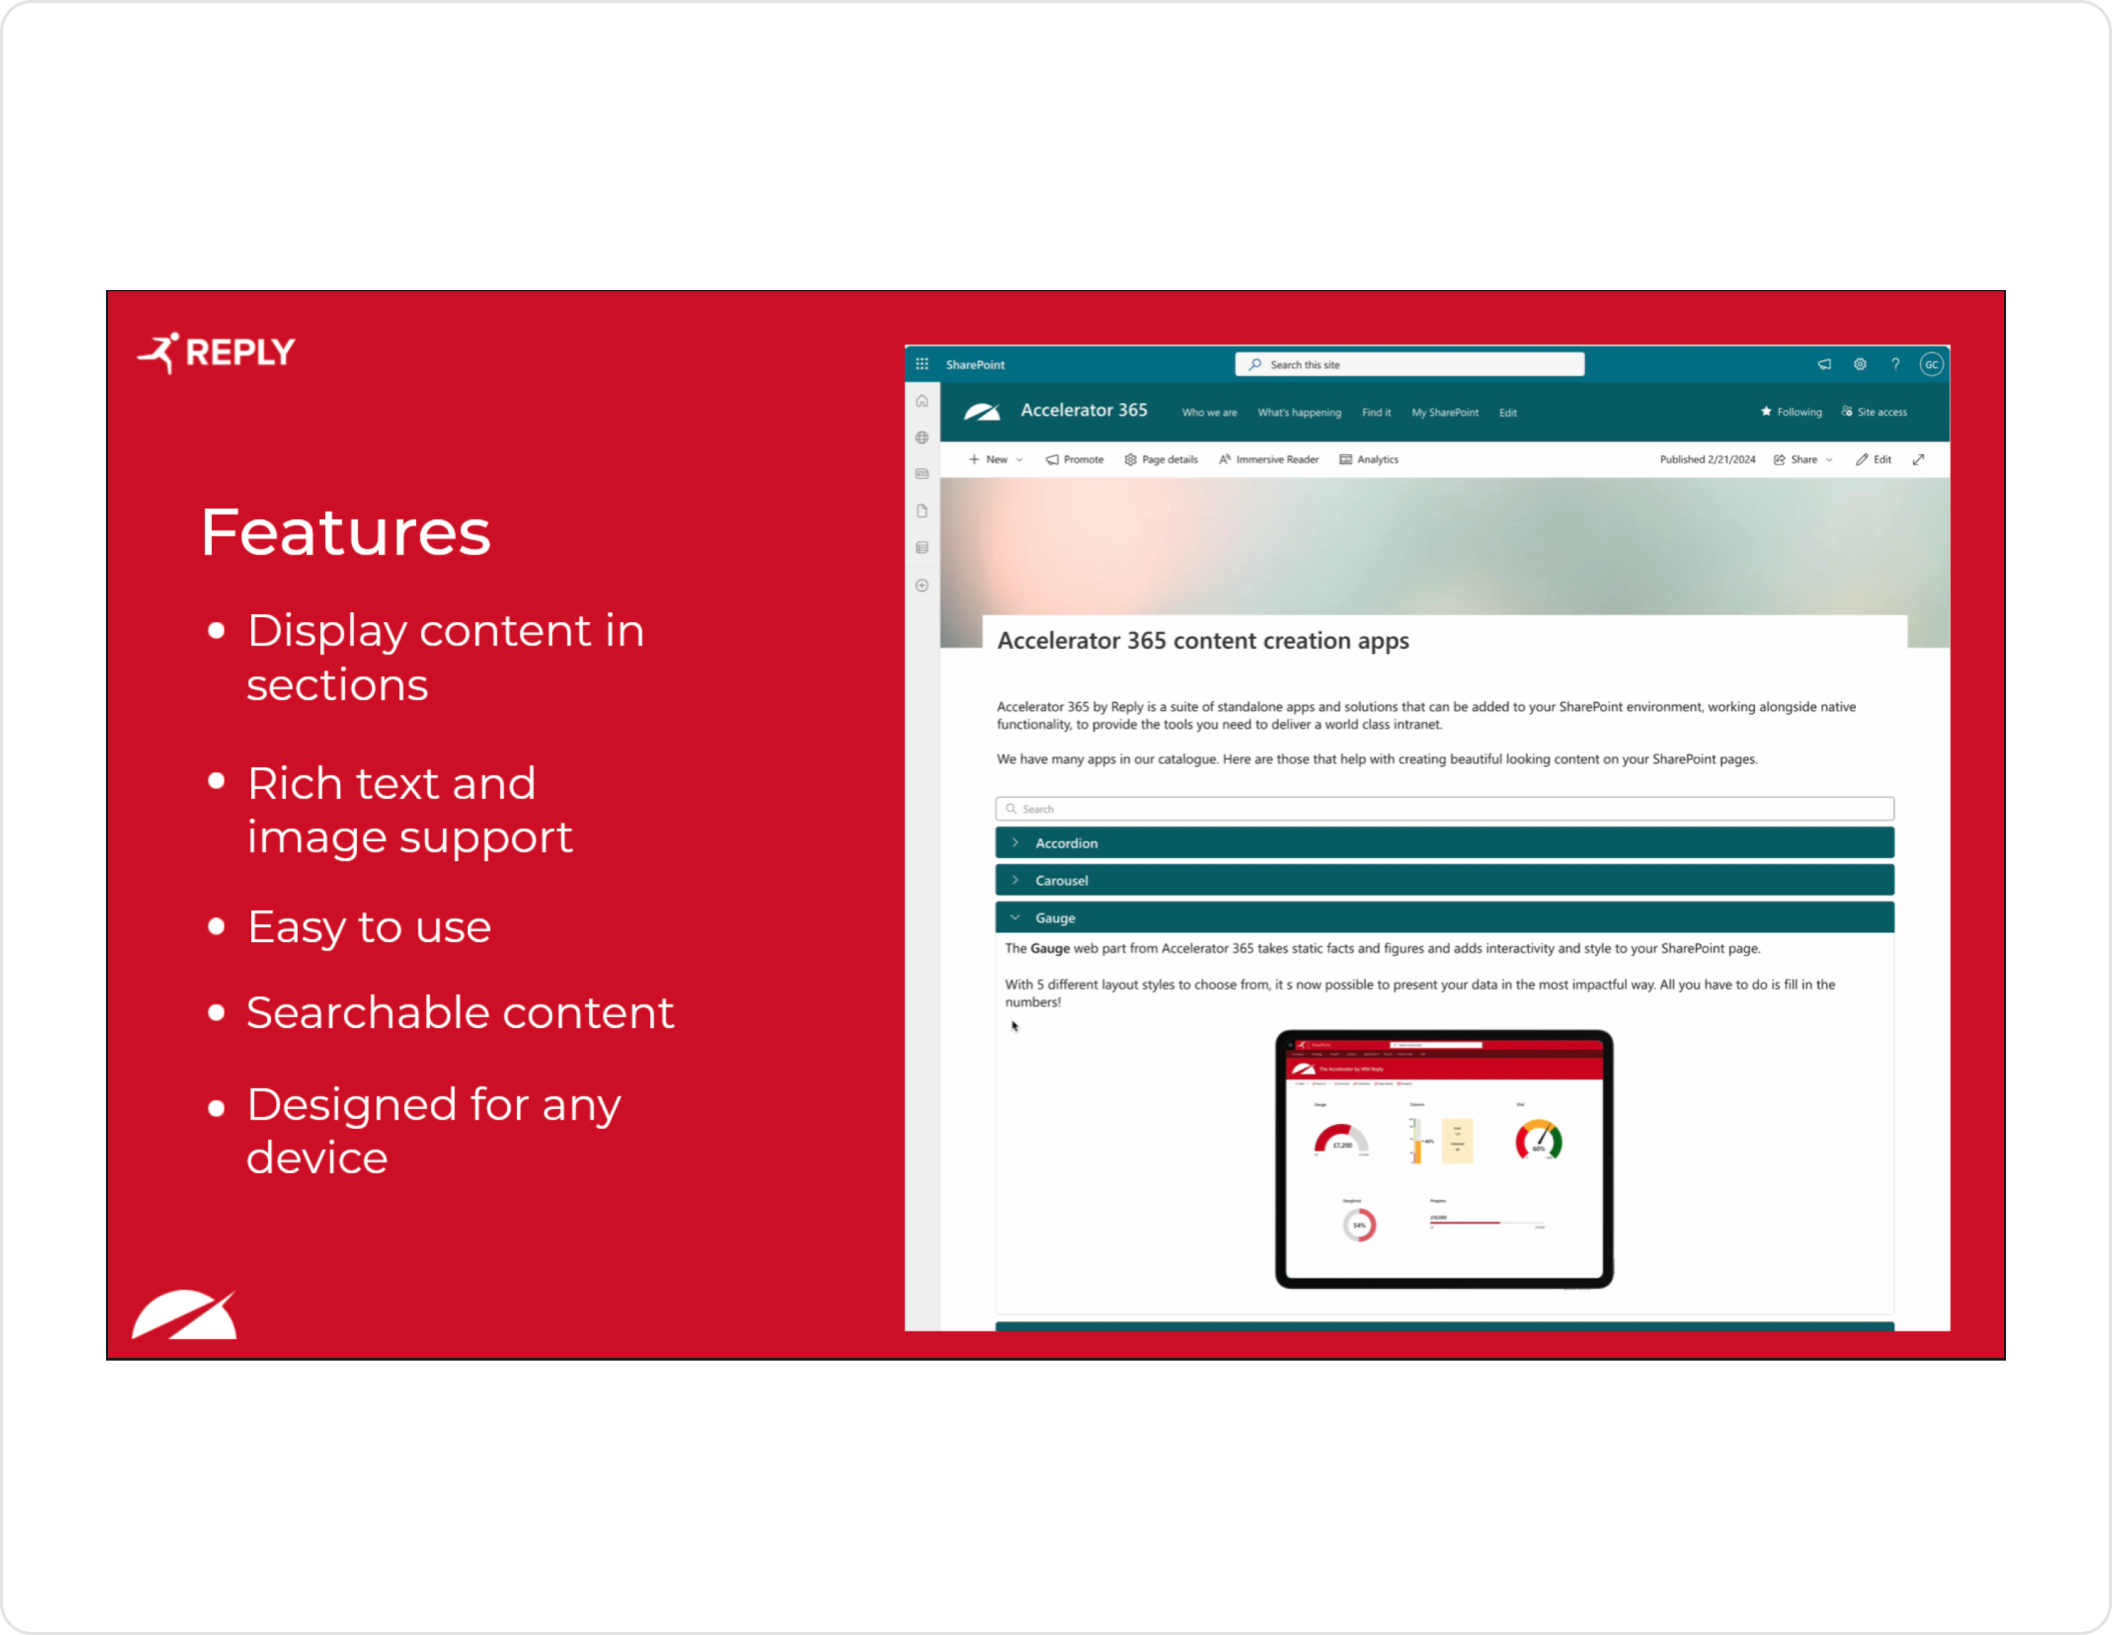
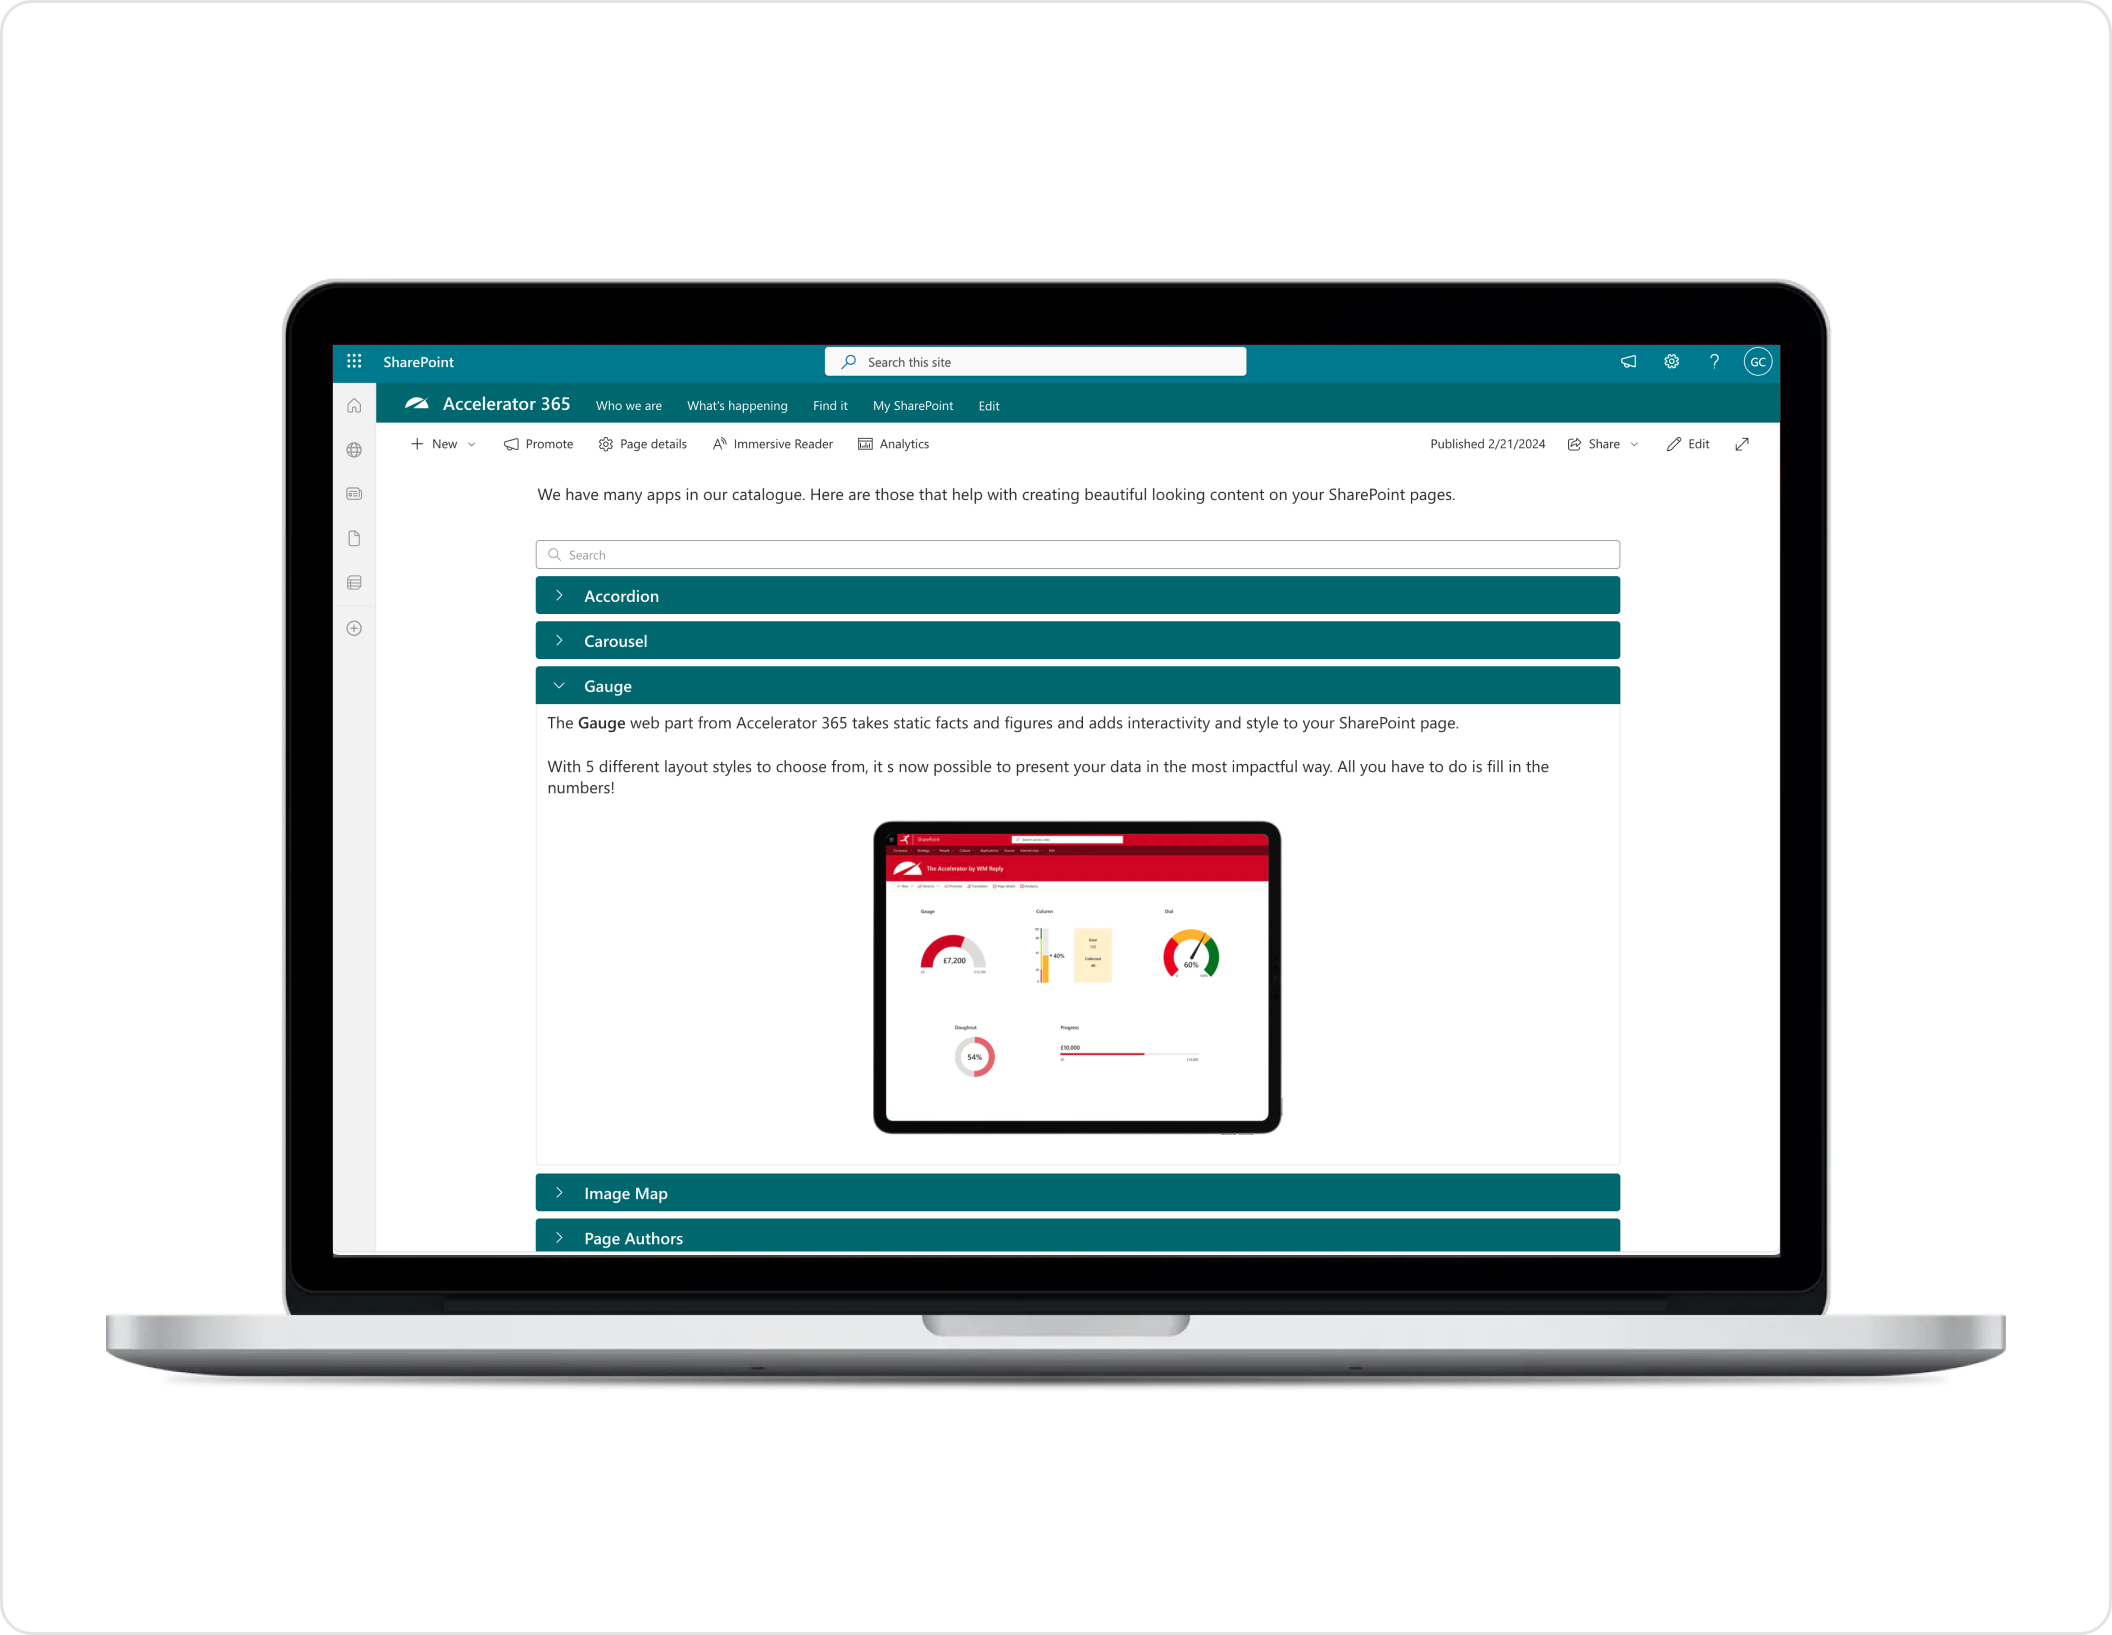
The Gauge web part from Accelerator 365 takes static facts and figures and adds interactivity and style to your SharePoint page.
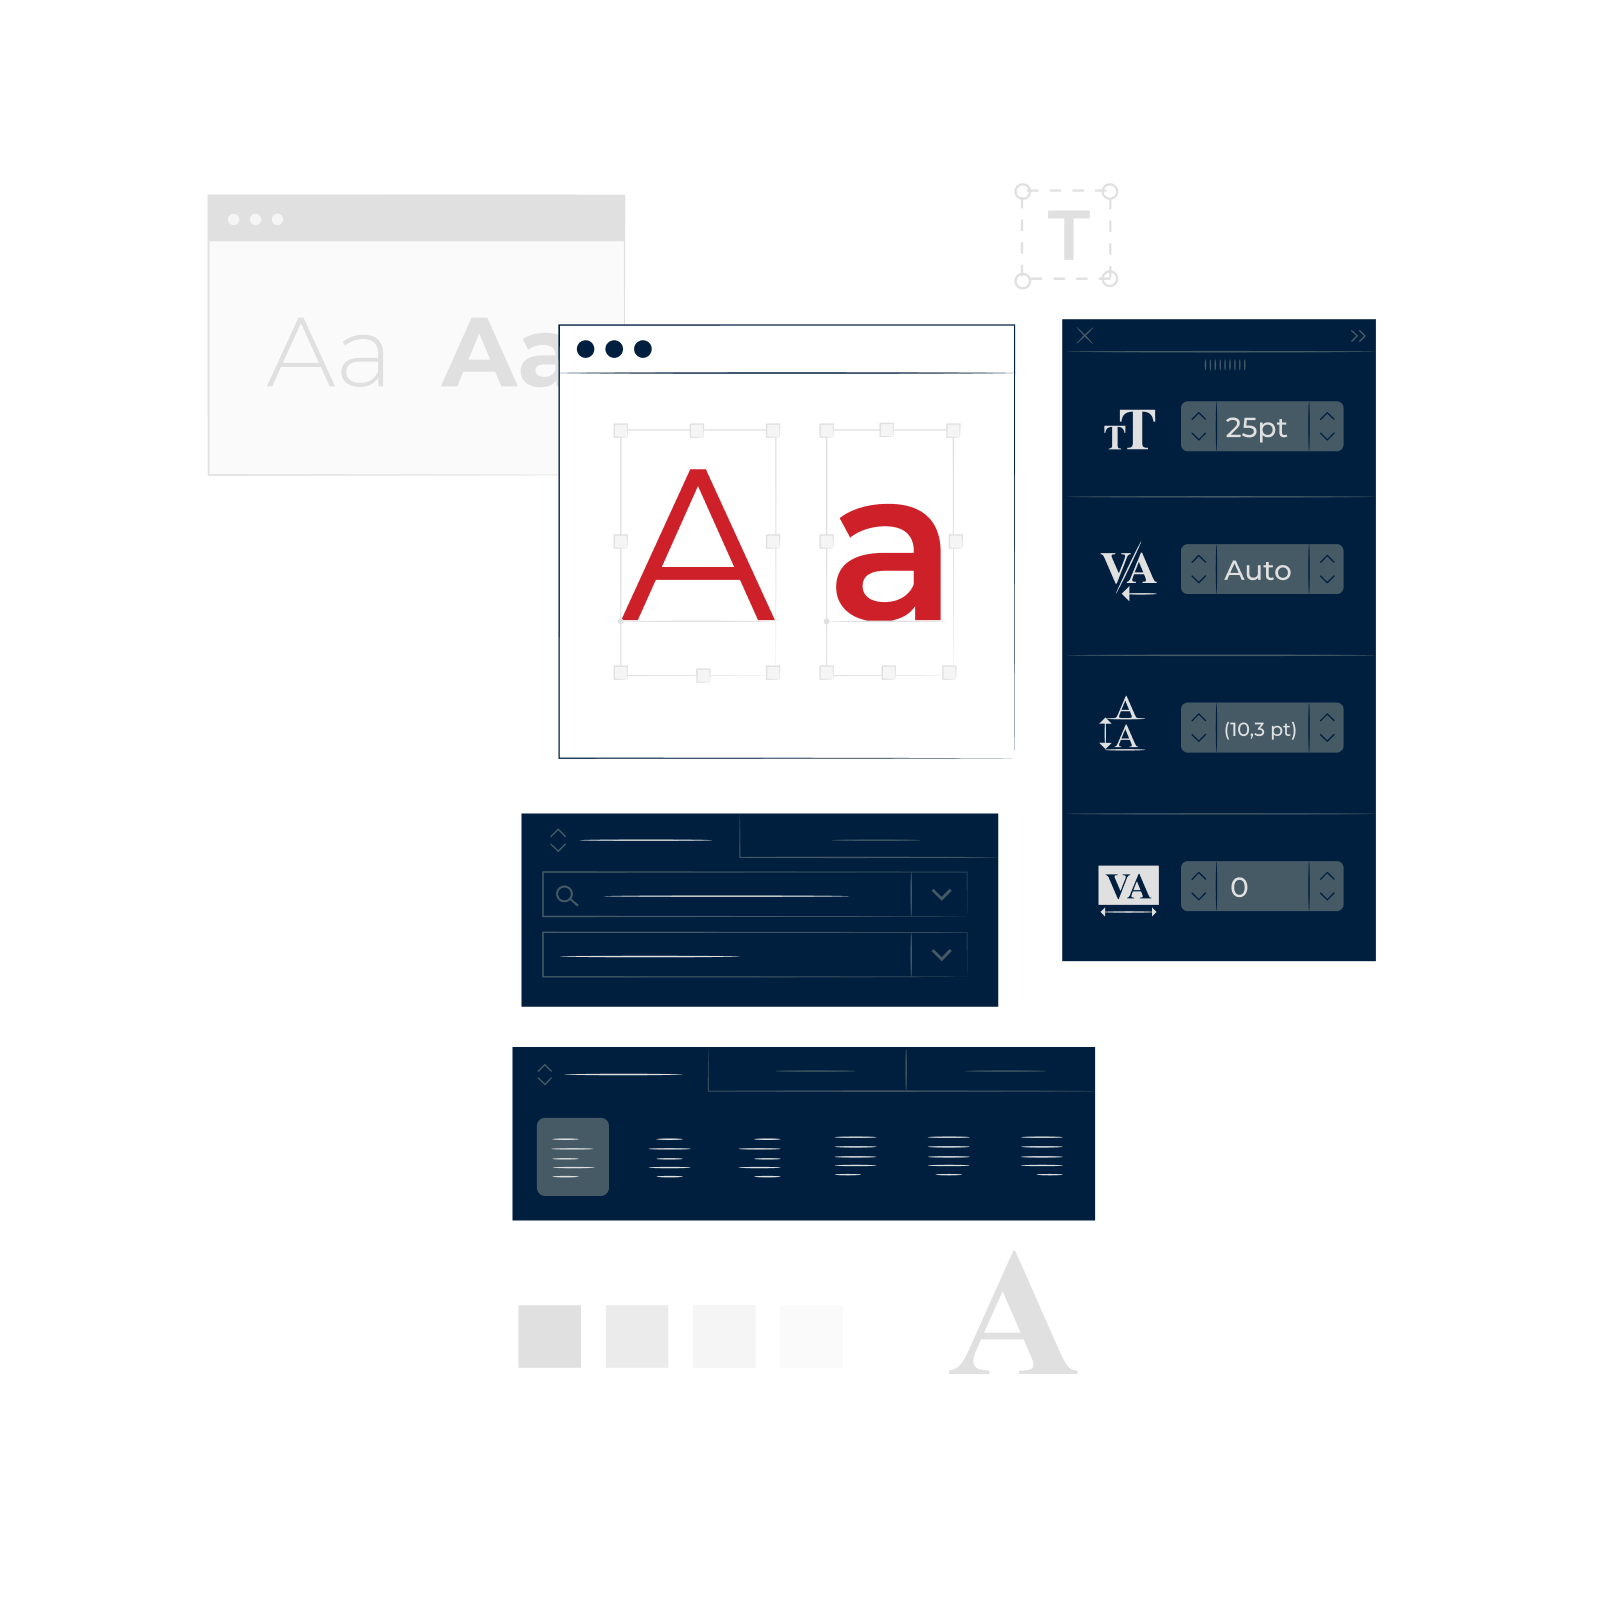
With 5 different layout styles to choose from, it s now possible to present your data in the most impactful way. All you have to do is fill in the numbers!
Make your data beautiful
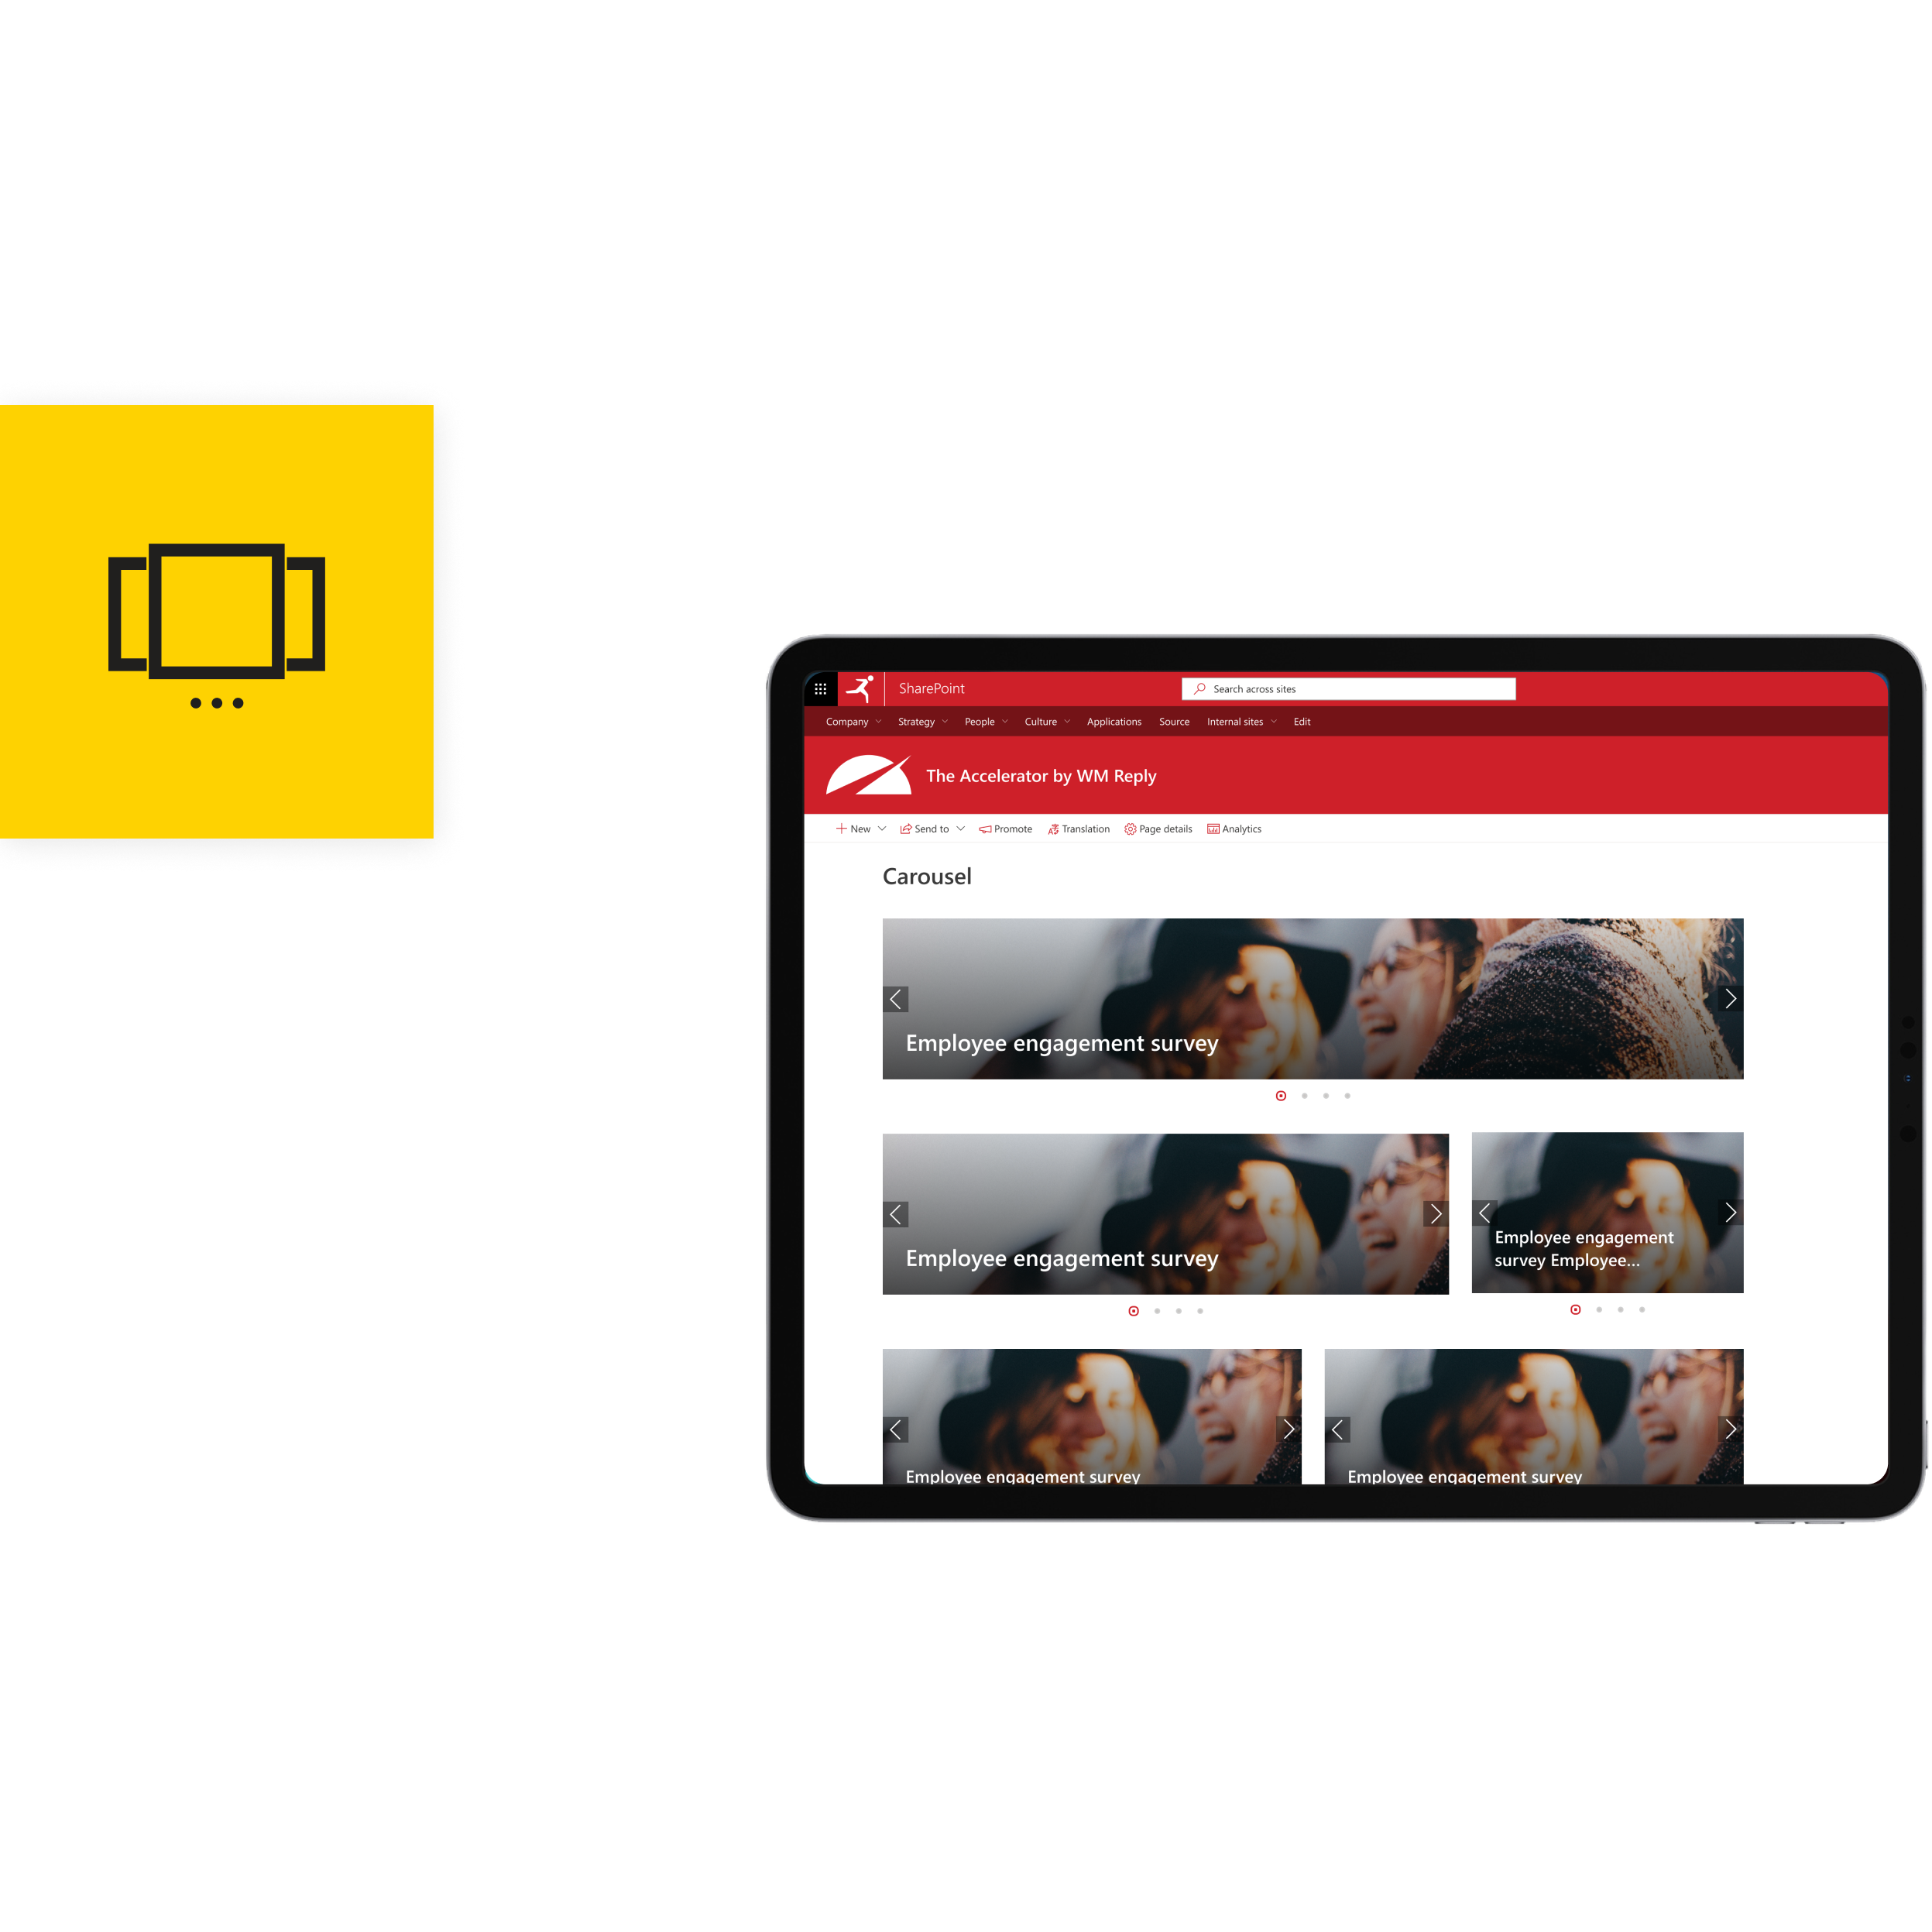
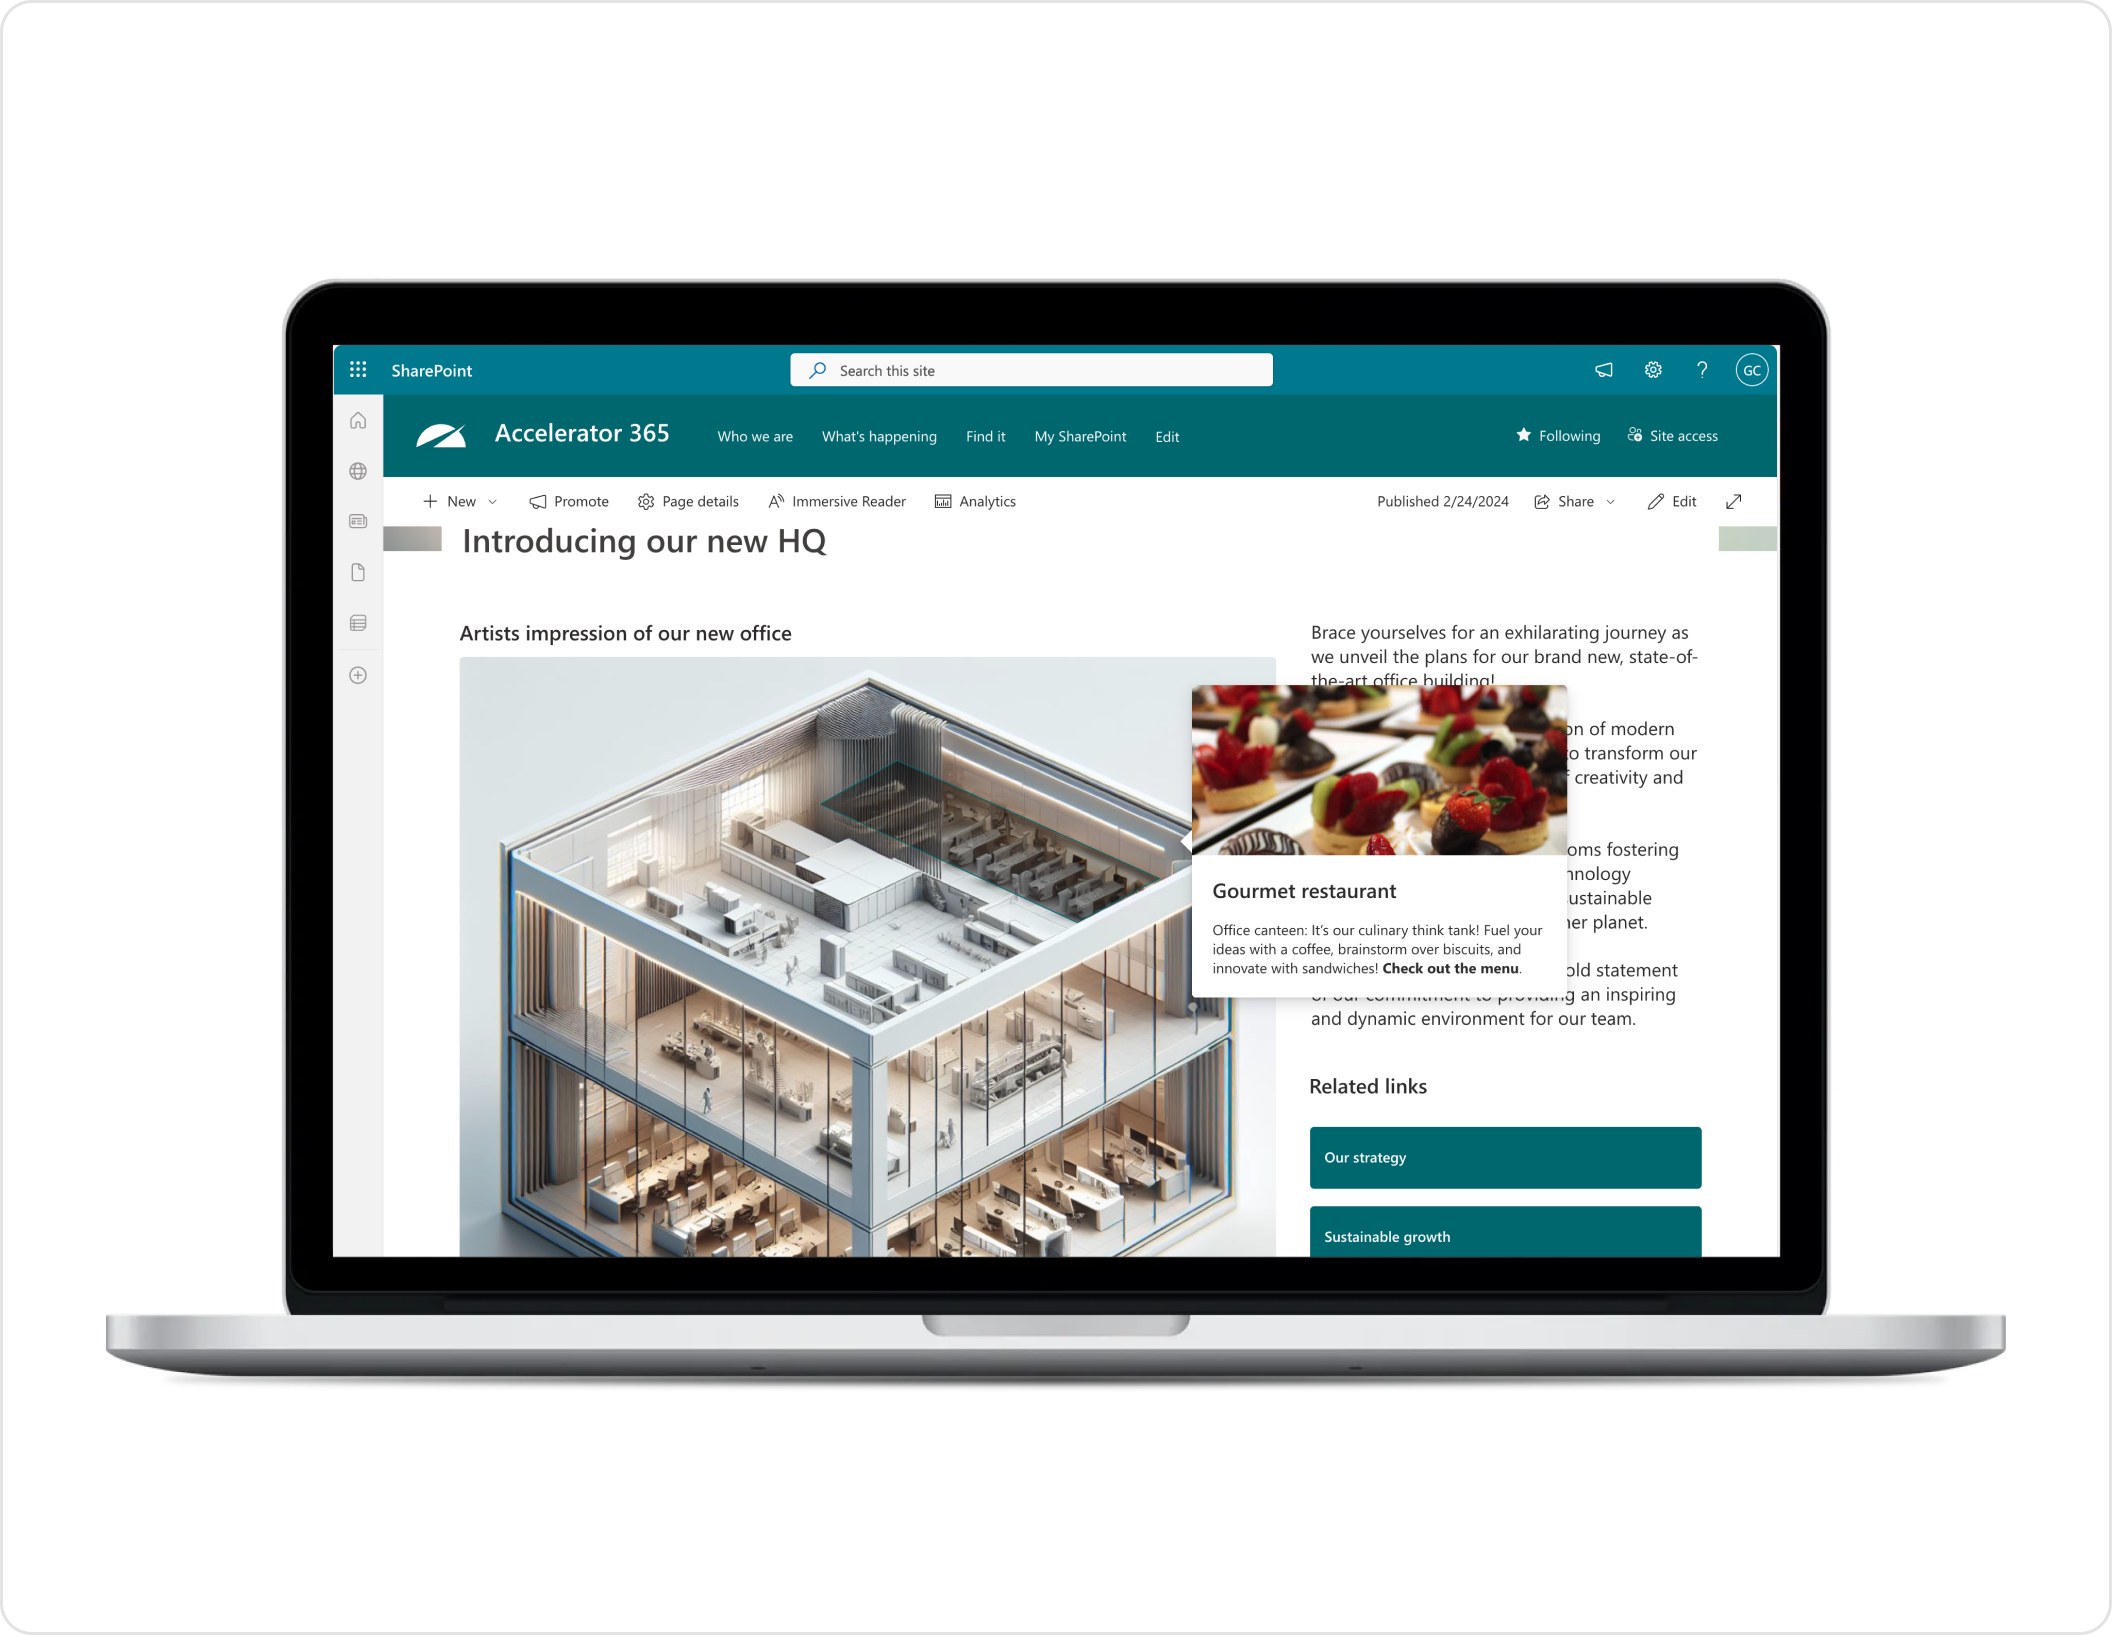
Data is all around us and your SharePoint content is unlikely to be any different. The Gauge apps provides an interactive series of data visualisations to add a little extra pop to your content. It could be showing progress towards your sustainability targets, or number of responses in the employee engagement survey - whatever the statistic; make it beautiful with the Gauge web part.
Make your data beautiful
Data is all around us and your SharePoint content is unlikely to be any different. The Gauge apps provides an interactive series of data visualisations to add a little extra pop to your content. It could be showing progress towards your sustainability targets, or number of responses in the employee engagement survey - whatever the statistic; make it beautiful with the Gauge web part.
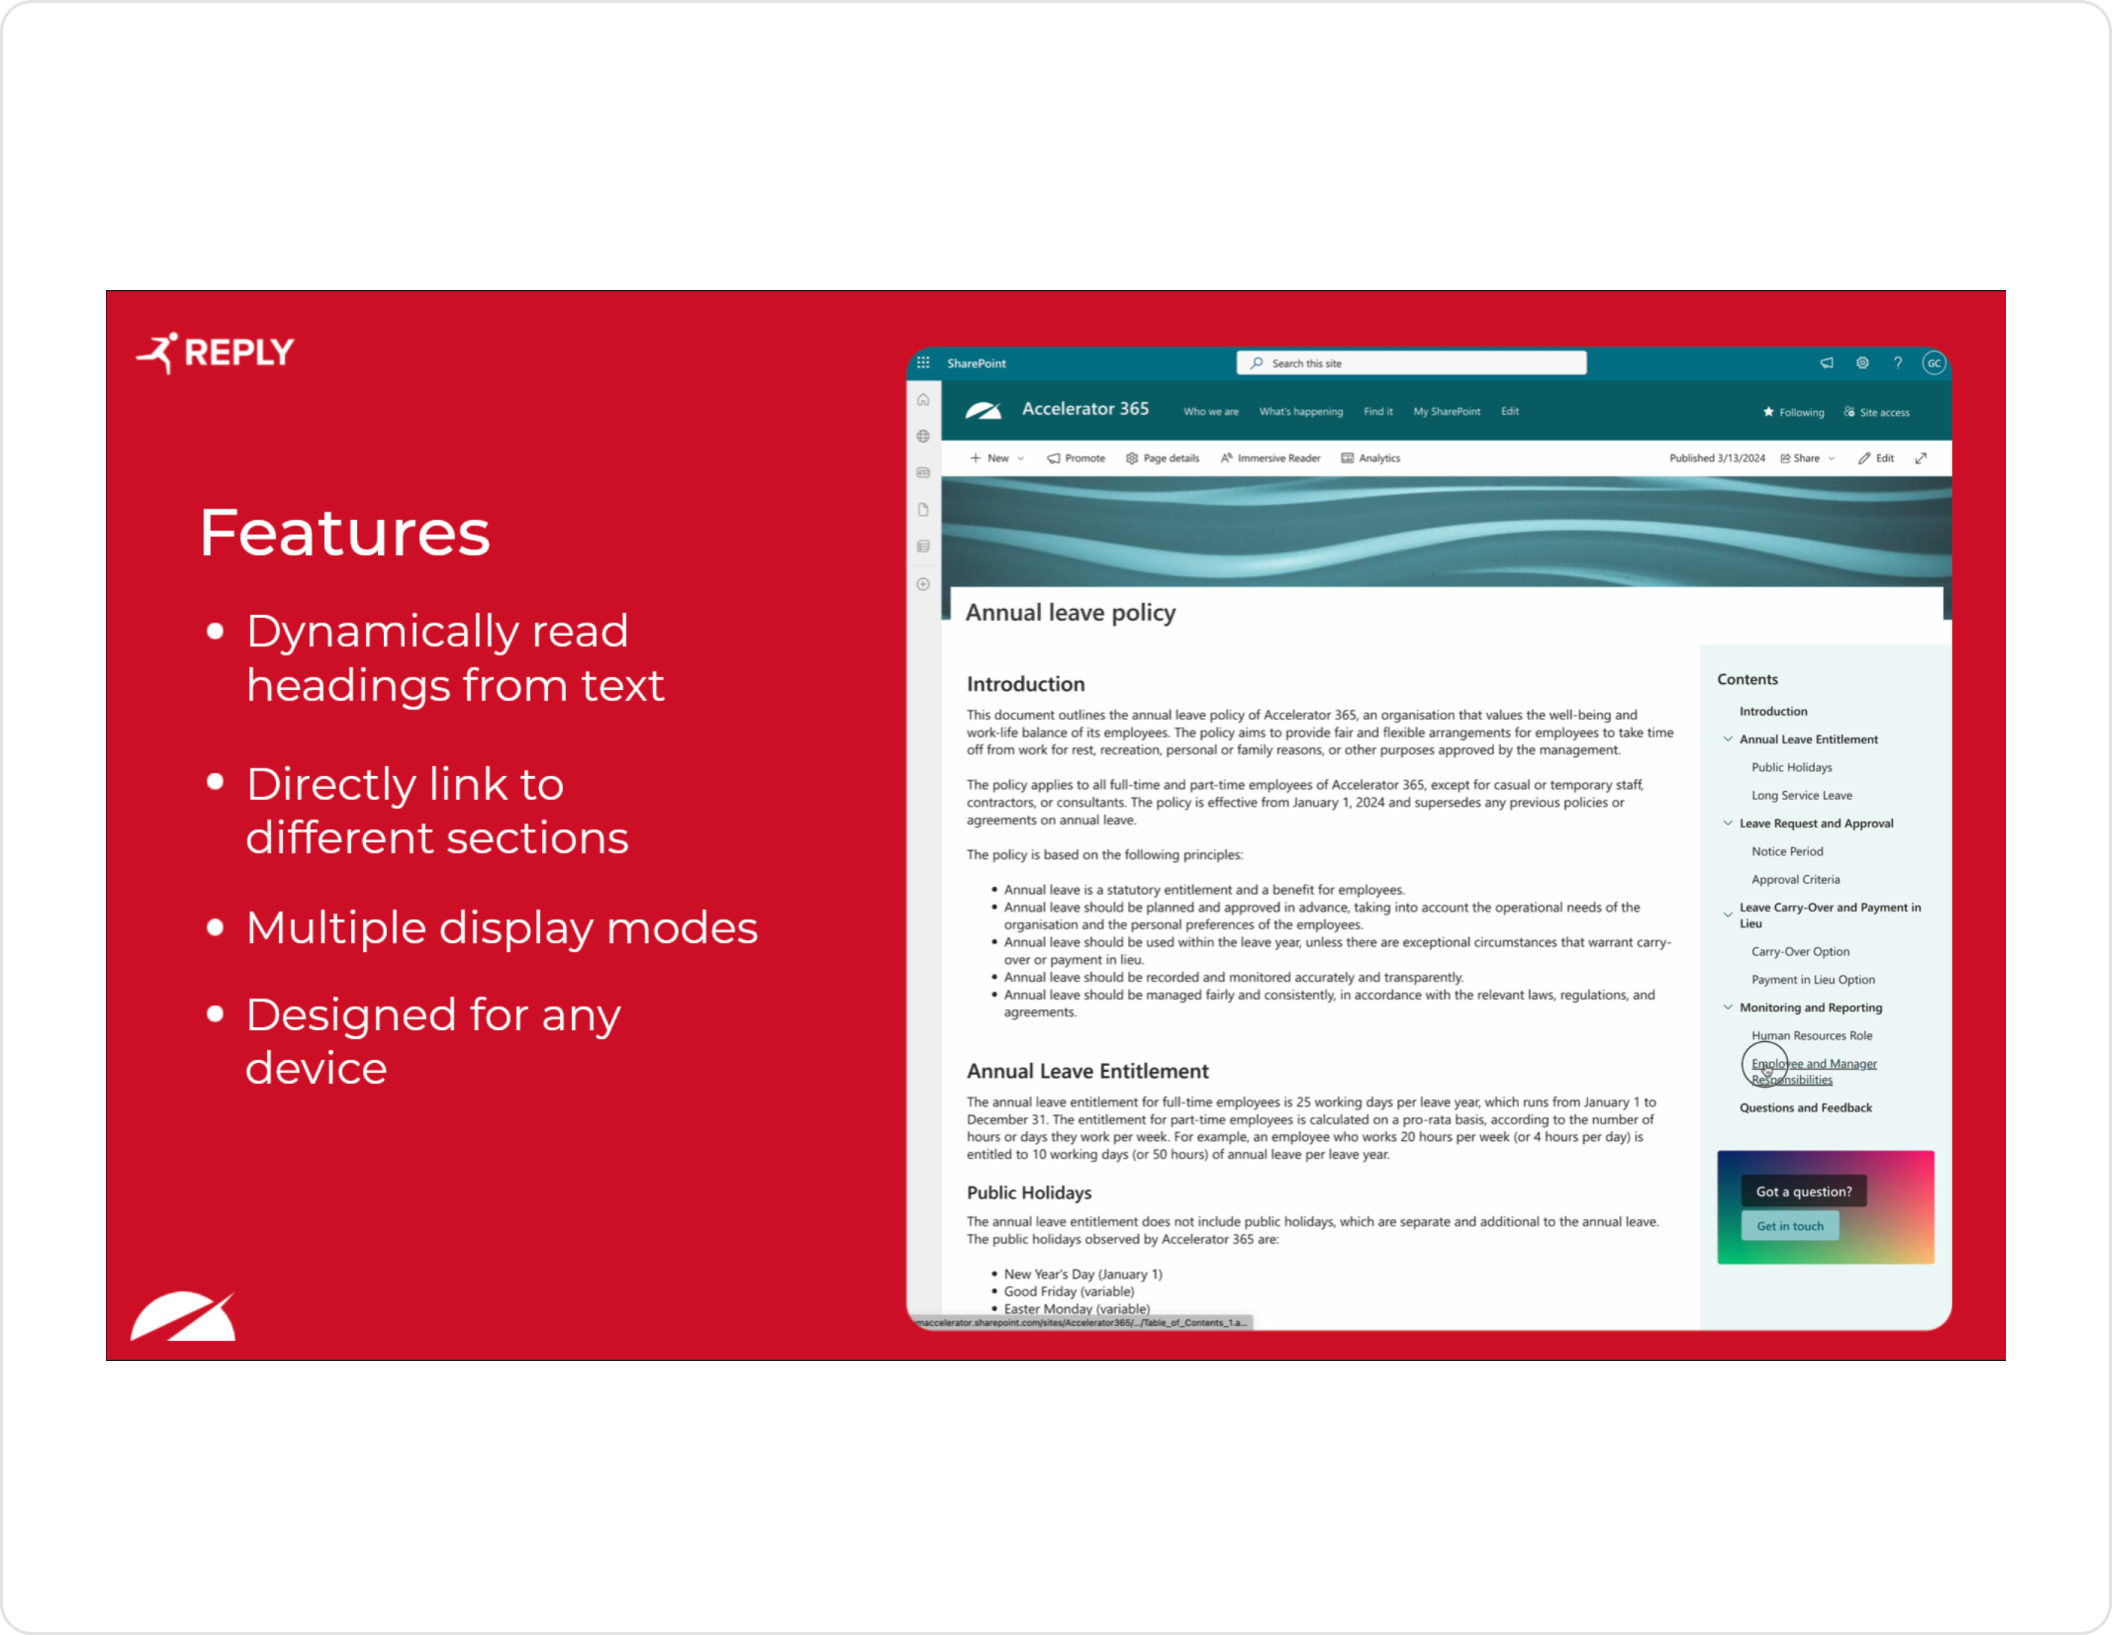
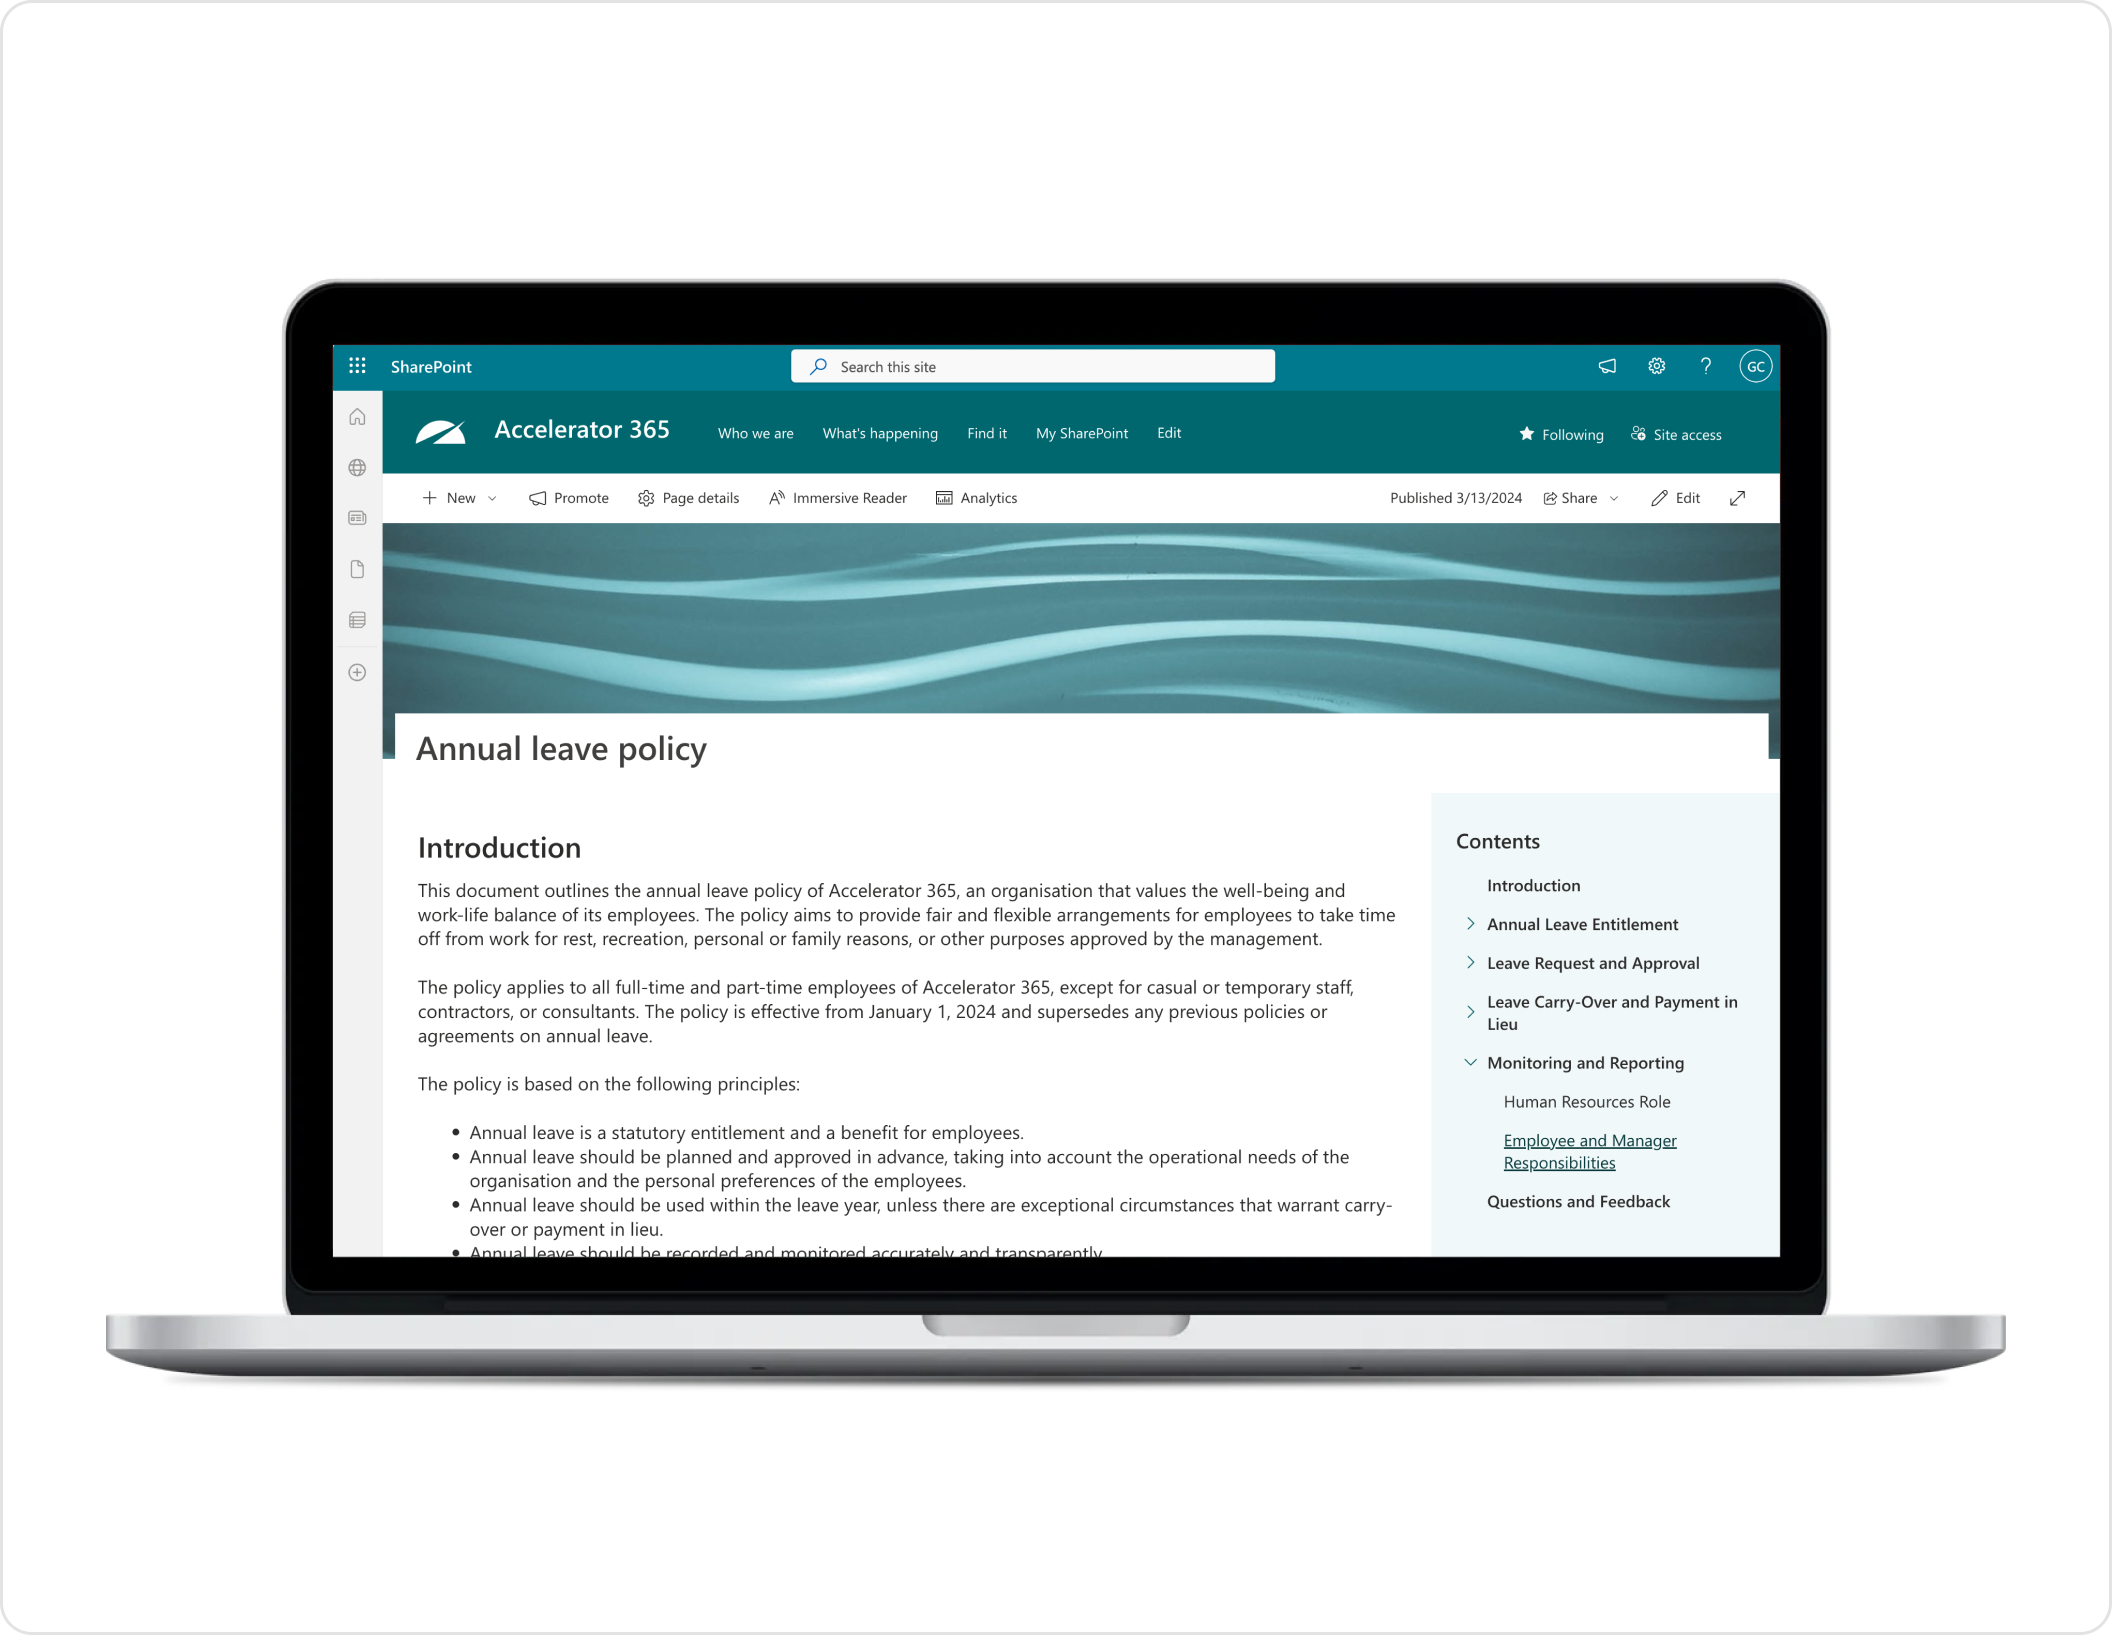
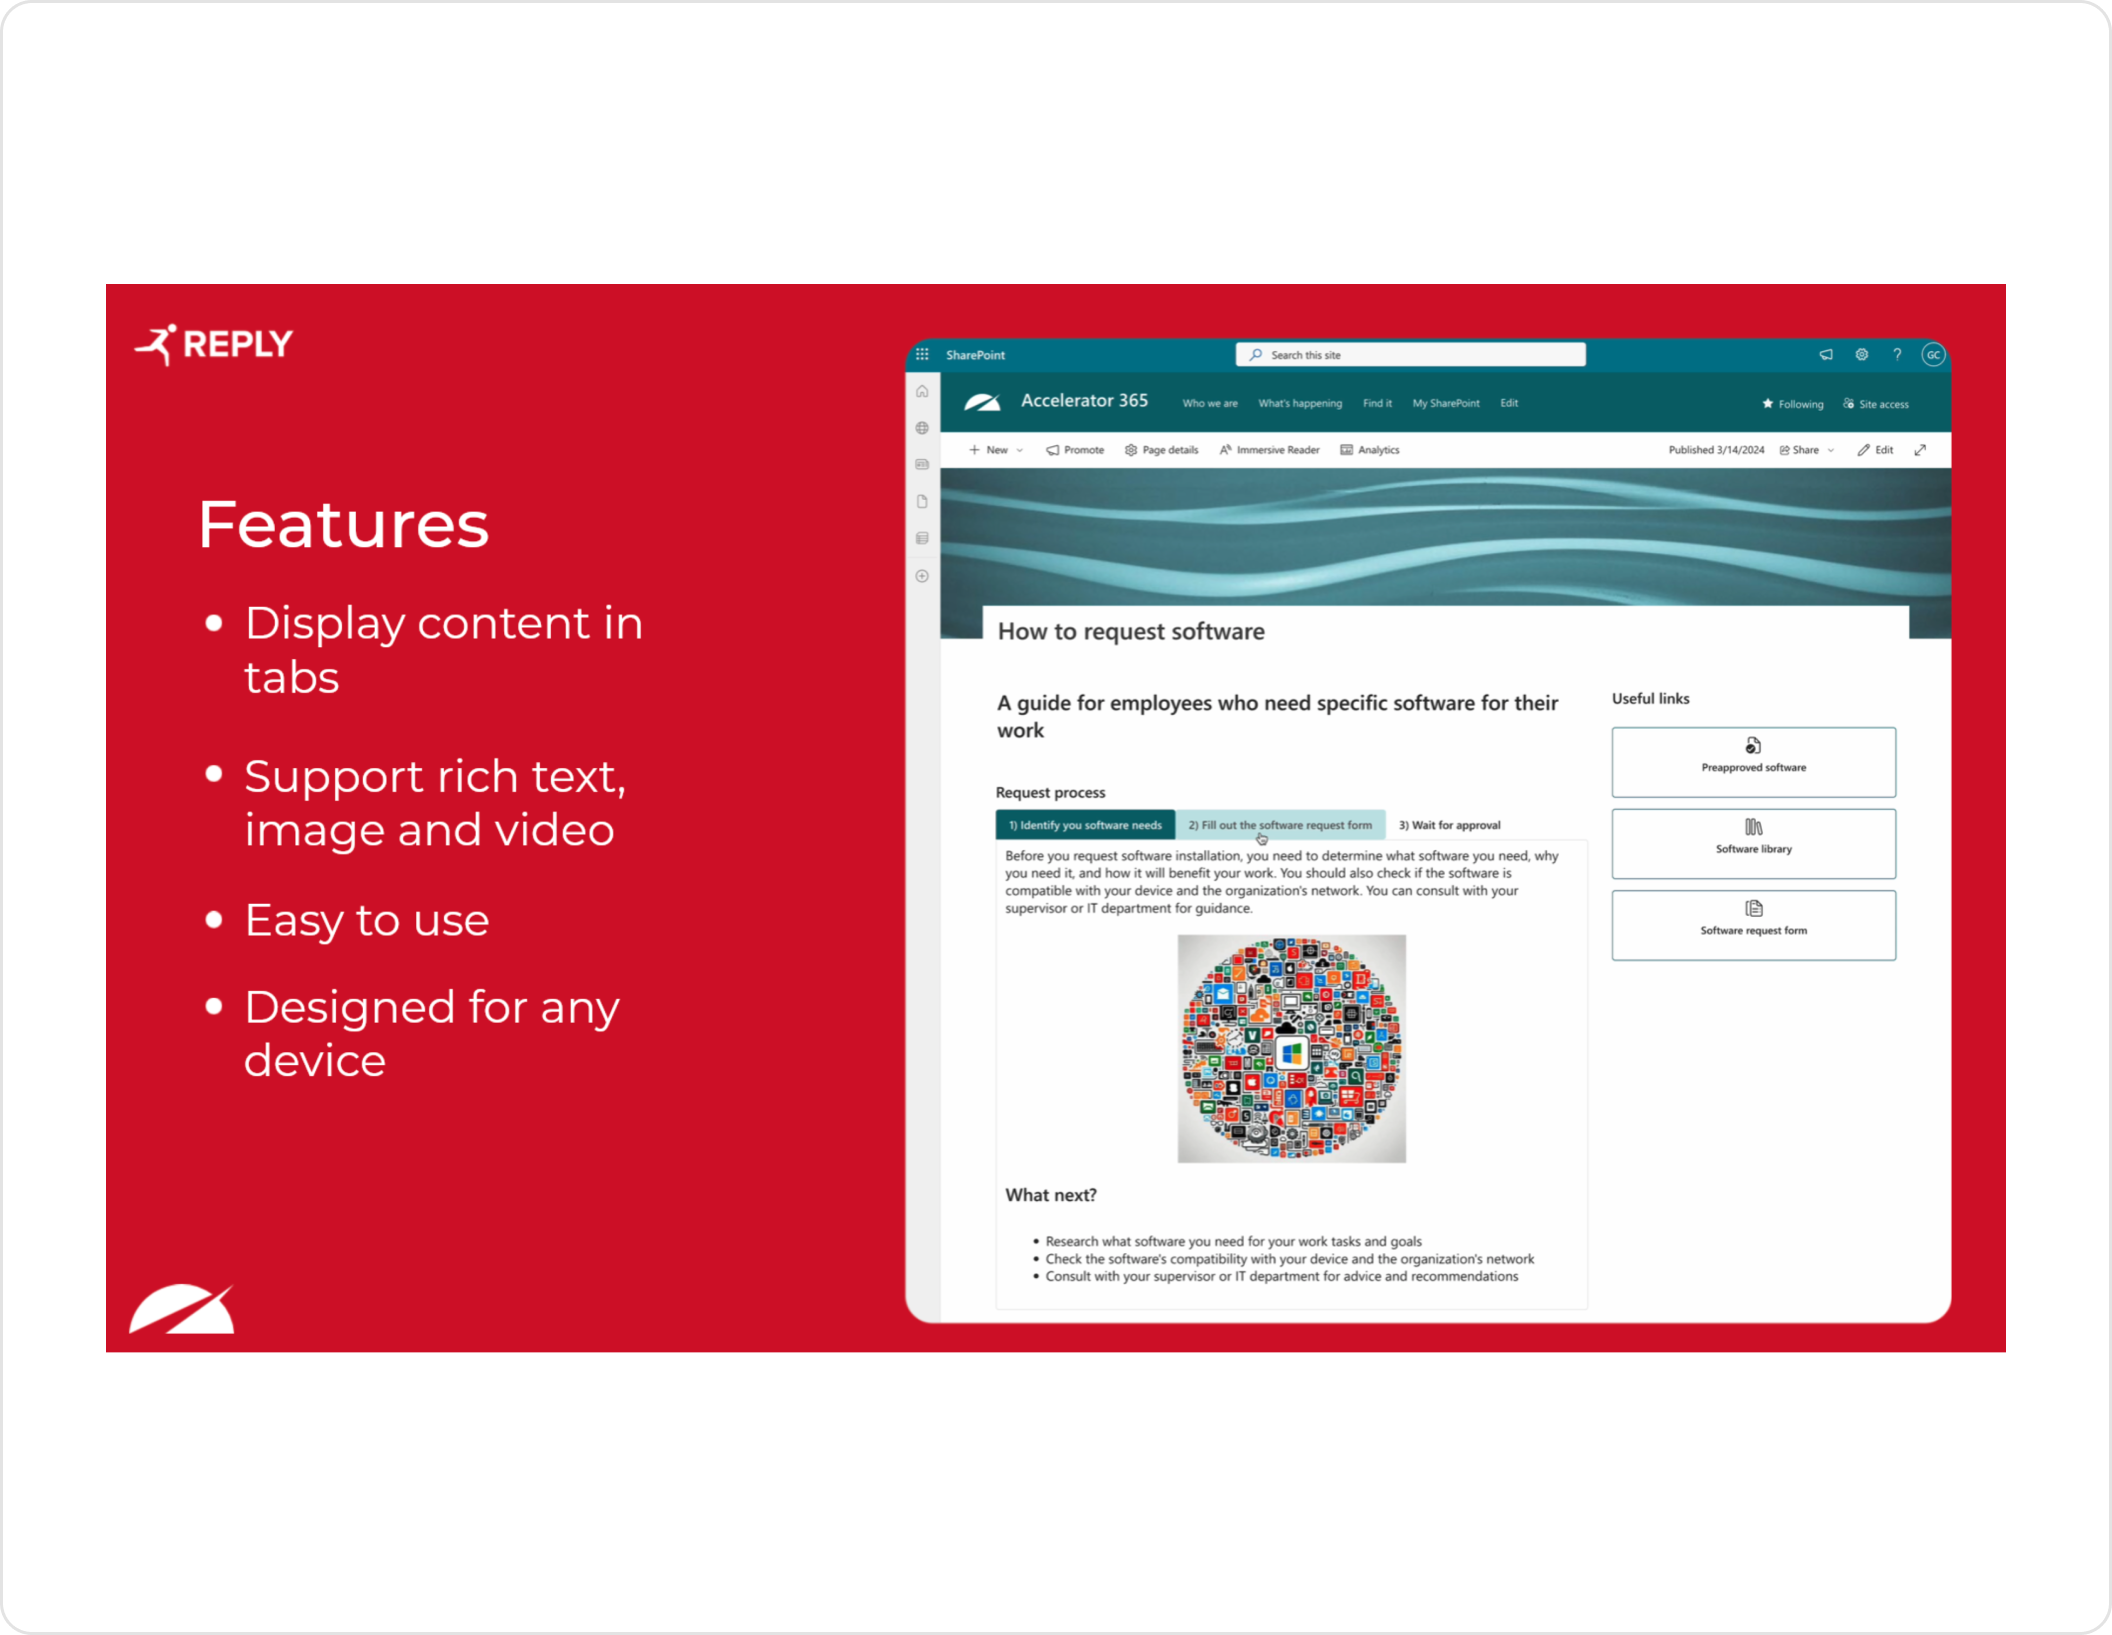
Highlighted features


FAQs
Got a question? The chances are that we've already answered it! Browse our frequently asked questions for this app, or view our knowledge base for even more detail.
Can I try this app on my SharePoint site?
Does this app work in Microsoft Viva Connections?
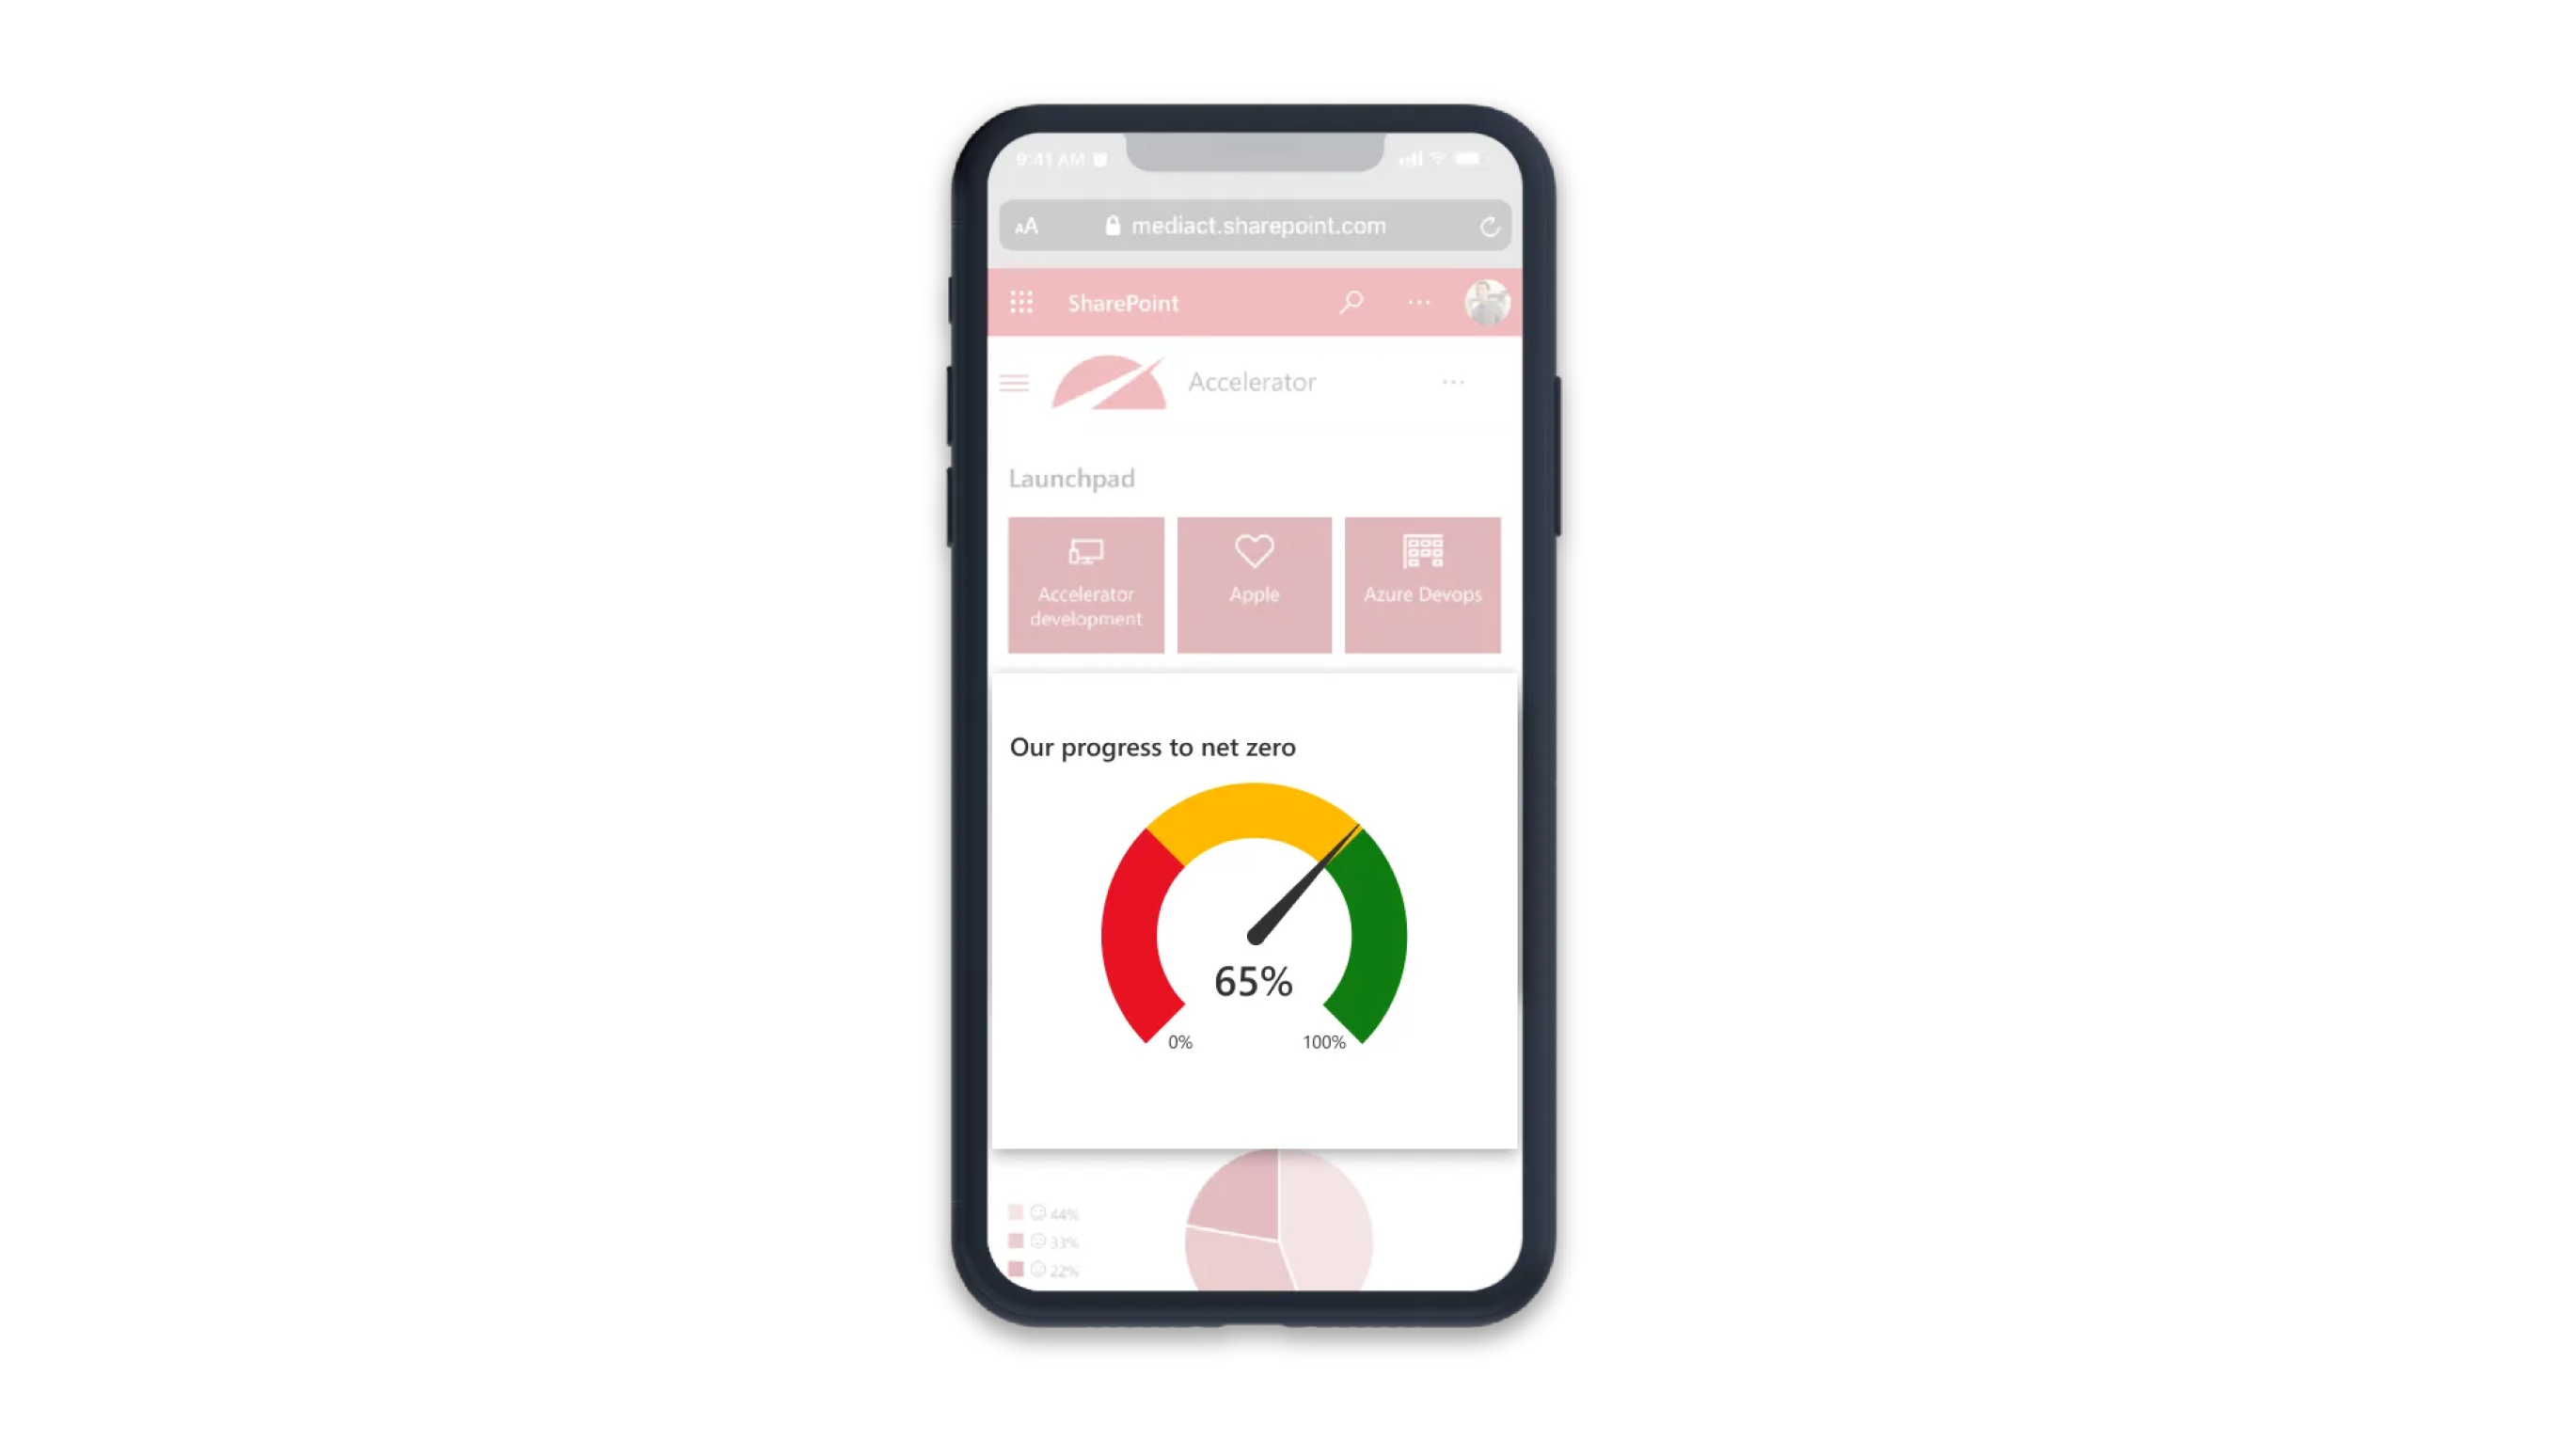
Does this app work on mobile devices?
You might also be interested in...

Proud to be part of the Reply network